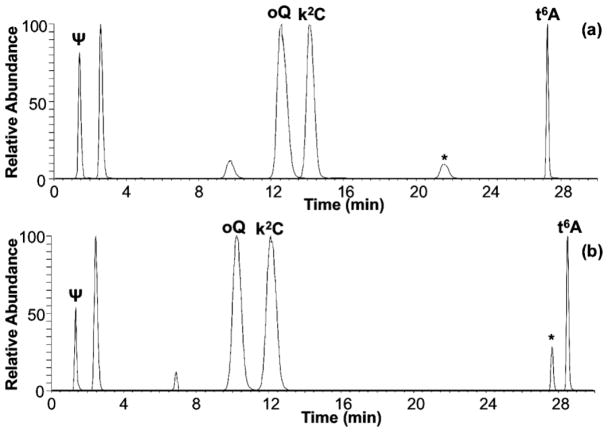
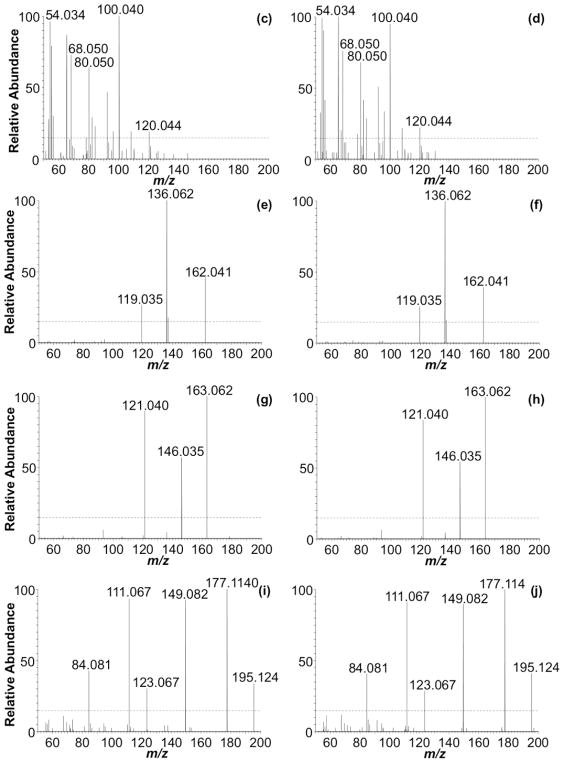
Figure 7.
Comparison of extracted ion chromatograms (XICs) for Ψ, t6A, oQ and k2C detected in E. coli using (a) LC method 1 and (b) LC method 2. * indicates t6A diastereomer. Corresponding HCD fingerprints from each of the different LC methods for Ψ (c) method 1/(d) method 2, t6A (e) method 1/(f) method 2, oQ (g) method 1/(h) method 2 and k2C (i) method 1/(j) method 2.


