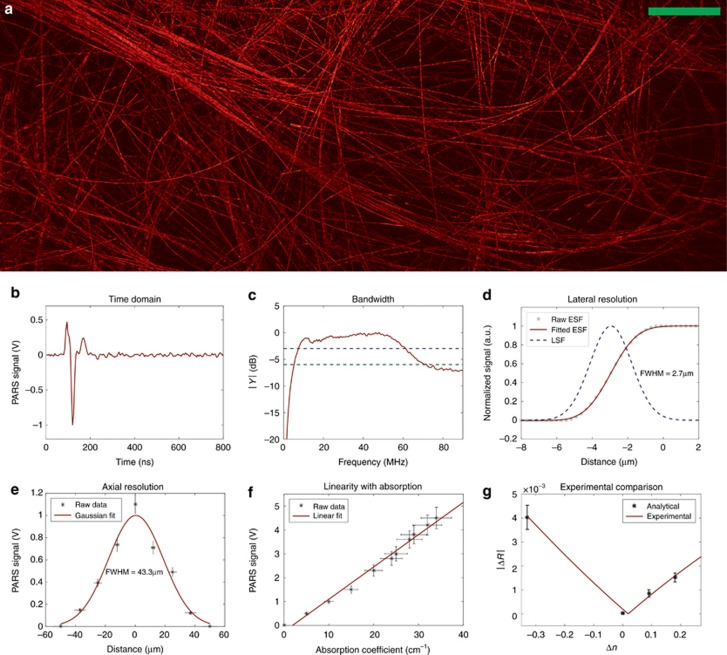
Figure 3.
Phantom studies. (a) Carbon-fiber network image using mechanical scanning (b) Time domain PARS signal due to a single carbon fiber. (c) The −3 dB (blue line) and −6 dB (green line) frequency response bandwidth of PARS system by imaging a carbon fiber. (d) Line spread function (LSF) and edge spread function (ESF) are presented. The ESF was extracted directly from the captured voltage signal data of a single carbon fiber. From this, the LSF was calculated. The full-width-half-maximum (FWHM) lateral resolution was estimated as 2.7±0.5 μm (R2=0.999). (e) The signal strength as a function of depth measured as FWHM of 43.3±5 μm (R2=0.894). (f) Measured photoacoustic signals from various red dye concentrations producing different absorption coefficients (R2=0.988). (g) Probe beam intensity modulation signals as a function of refractive index contrast. An absorbing bottom layer with a constant refractive index was positioned below several top layers with various refractive indices. The original data of PARS signal versus Δn=(n1−n2) is shown in the Table 1 of the Supplementary Information (R2=0.995). Scale bar: 500 μm.

