. 2016 Mar 4;5(3):788–799. doi: 10.1039/c6tx00004e

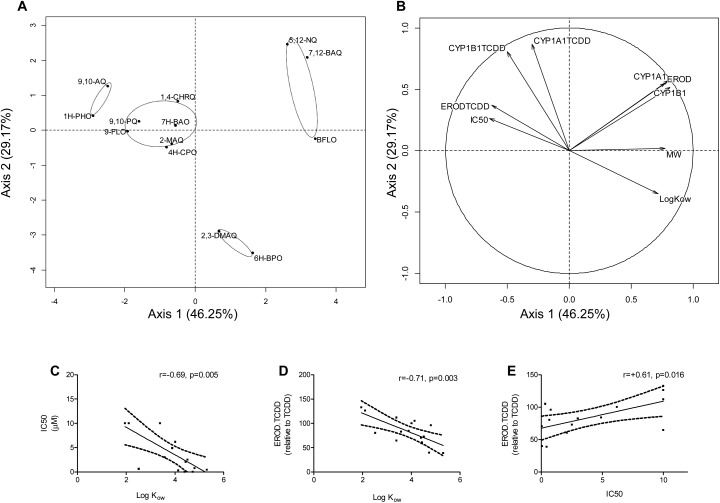
Fig. 6. Inhibition and induction of CYP1 by oxy-PAHs are driven by lipophilicity. Principal component analysis representing normalized coefficients for the 13 oxy-PAHs with data at 1 μM exposure and 6 h post exposure on the first two axes (axis 1 + axis 2: 75.42%). The individual factor map is shown in (A) and the variables factor map in (B). EROD refers to cellular EROD activity of single exposure (Fig. 1), CYP1A1 and CYP1B1 refer to gene expression of single oxy-PAH exposure (Fig. 2), ERODTCDD to cellular EROD activity of oxy-PAHs in combination with TCDD (Fig. 4), CYP1A1TCDD and CYP1B1TCDD refer to gene expression in combination with TCDD (Fig. 5), MW to molecular weight and, IC50 to CYP1A1 IC50 values (both in Table 1). Pearson correlation analysis between log Kow, IC50 and/or ERODTCDD data are shown in panels (C)–(E), respectively. Plots show linear regression with 95% confidence bands, Pearson's r and p-value. For more details see Materials and methods.

Fig. 6