. 2018 Jan 10;7(2):271–282. doi: 10.1039/c7tx00262a

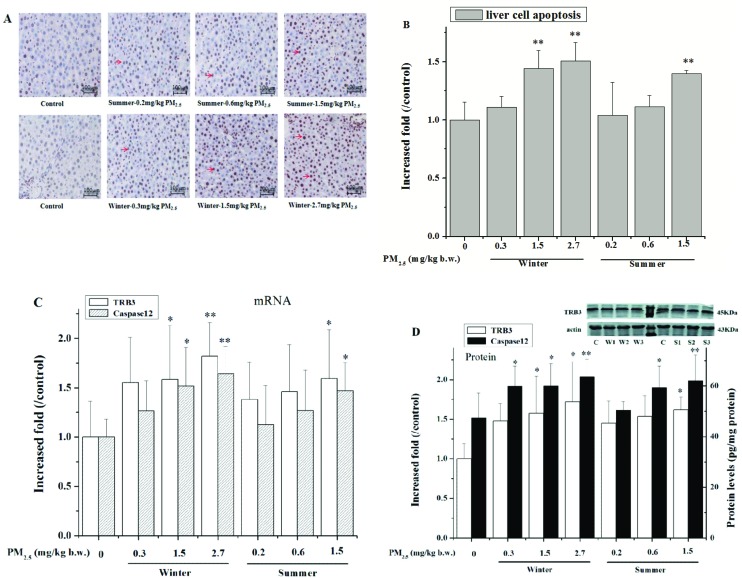
Fig. 6. Effects of PM2.5 on liver cell apoptosis and gene expression of TRB3 and caspase 12 in different groups. (A) Liver cell apoptosis in the testis was detected by TUNEL. Arrows indicate TUNEL positive cells in the livers; ×200 magnification. (B) Increased folds of TUNEL positive cells in the livers in PM2.5-groups relative to the control. (C) and (D) TRB3 and caspase 12 mRNA and protein levels in livers of rats treated with PM2.5. Apoptosis change, mean expressions of mRNA and protein in each treated group are shown as increases, compared to the mean expression in the control group, which has been ascribed an arbitrary value of 1. The values are mean ± SD from five individual samples. Using one-way ANOVA, compared with the control group, significant difference is indicated by *P < 0.05 and **P < 0.01.

Fig. 6