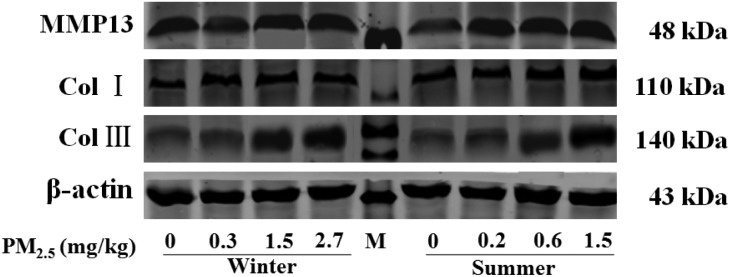
Table 3. Exposure to PM2.5 induces expression of fibrosis related molecules in the livers of rats in different groups.
| Groups (mg kg–1) | MMP13 | Col I | Col III | TGF-β1 |
| mRNA expressions in livers | ||||
| 0 | 1.00 ± 0.51 | 1.00 ± 0.31 | 1.00 ± 0.32 | 1.00 ± 0.25 |
| 0.2 | 1.15 ± 0.36 | 1.29 ± 0.46 | 1.27 ± 0.26 | 1.24 ± 0.23 |
| 0.6 | 1.54 ± 0.56 | 1.33 ± 0.43 | 1.48 ± 0.38 | 1.36 ± 0.27 |
| 1.5 | 2.21 ± 0.63** | 1.58 ± 0.45* | 1.66 ± 0.60* | 1.51 ± 0.29* |
| r | 0.99 | 0.92 | 0.92 | 0.91 |
| 0.3 | 1.64 ± 0.59 | 1.39 ± 0.20 | 1.50 ± 0.40 | 1.28 ± 0.44 |
| 1.5 | 2.16 ± 0.43** | 1.64 ± 0.57* | 1.69 ± 0.23** | 1.46 ± 0.40* |
| 2.7 | 2.33 ± 0.88** | 1.78 ± 0.30** | 1.71 ± 0.42** | 1.62 ± 0.40** |
| r | 0.90 | 0.91 | 0.79 | 0.93 |
| Groups | Protein expressions in livers |
|||
| 0 | 1.00 ± 0.15 | 1.00 ± 0.26 | 1.00 ± 0.26 | 53.88 ± 17.52 |
| 0.2 | 1.12 ± 0.21 | 1.46 ± 0.52 | 1.12 ± 0.16 | 57.19 ± 22.90 |
| 0.6 | 1.29 ± 0.31 | 1.73 ± 0.37 | 1.34 ± 0.55 | 77.58 ± 21.00 |
| 1.5 | 1.49 ± 0.25* | 1.92 ± 0.42* | 1.70 ± 0.43* | 81.62 ± 26.79* |
| r | 0.98 | 0.88 | 0.99 | 0.89 |
| 0.3 | 1.16 ± 0.13 | 1.63 ± 0.46 | 1.19 ± 0.39 | 56.24 ± 18.26 |
| 1.5 | 1.44 ± 0.28* | 1.84 ± 0.46* | 1.77 ± 0.43* | 67.37 ± 14.40 |
| 2.7 | 1.59 ± 0.17** | 2.0 ± 0.38* | 1.89 ± 0.31* | 86.80 ± 22.80* |
| r | 0.98 | 0.84 | 0.95 | 0.99 |

|
