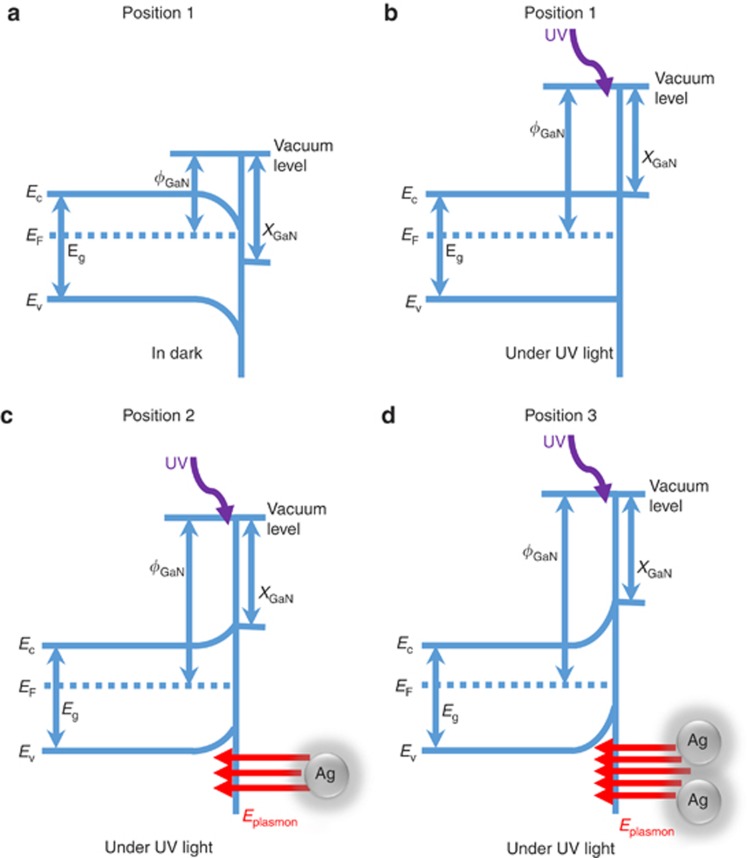
Figure 3.
Schematic band diagrams of the GaN substrate at positions 1, 2 and 3 (positions 1–3 are shown in Figure 2a). The band structure of GaN under dark conditions with the donor surface state is shown in (a). For position 1, as shown in (b), under UV illumination, the photoelectrons move to fill all of the donor surface states; as a result, the band bending is recovered. For position 2, as shown in (c), the Ag SP induces an electric field around itself under UV light; as a result, the band bends upward and the electrons accumulate at the surface around the Ag nanoparticle, especially between the two nanoparticles, as shown in (d). Both the electric fields from the nanoparticles have an effect on it, resulting in intense band bending between the nanoparticles.

