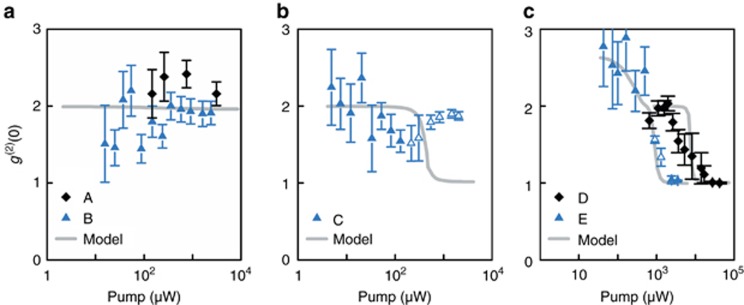
Figure 5.
Equal-time intensity correlation versus pump power for QD-micropillar (a) LEDs, (b) cavity-enhanced LED and (c) lasers. The gray curves are from theory. The data points are from experiment, where the solid symbols indicate  analysis by integration and the open symbols indicate fits considering the instrument impulse response of the TCSPC setup. TCSPC, time-correlated single-photon counting.

