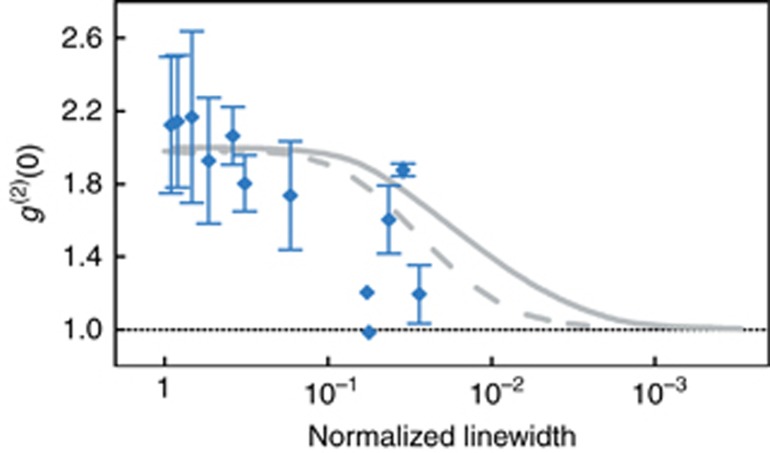
Figure 8.
Equal-time intensity correlation versus linewidth reduction for all emitters. The linewidth reduction is defined as the emission linewidth divided by the passive cavity width. The measured data for all emitters are combined. The averages and standard deviations at given linewidth intervals are plotted as blue diamonds and error bars, respectively. The calculated curves for emitters A, B and D all lay on the solid curve. Emitter C is shown by the dashed curve.

