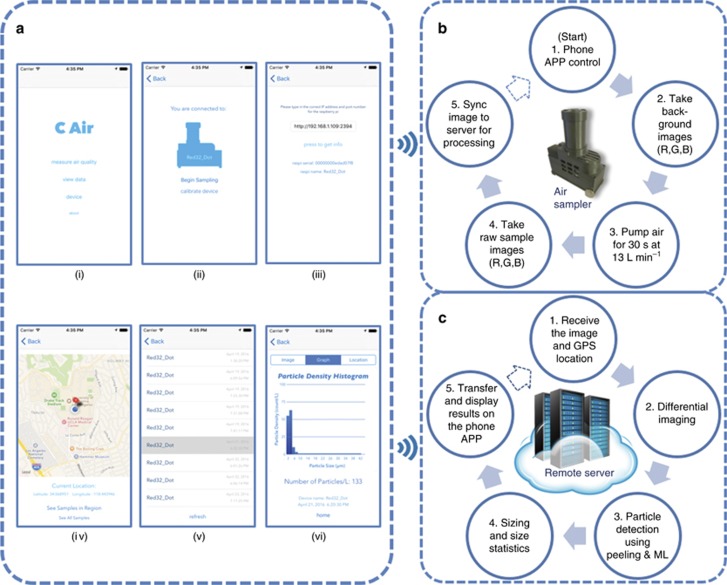
Figure 2.
c-Air work flow and iOS-based app interface. (a) iOS-based c-Air app interface: (i) ‘Welcome’ screen of the app with different options. (ii) ‘Take Measurement’ screen with a device-logo-shaped sampling button. (iii) Changing the device connection. The user can change the device to be connected by typing the IP address of the device. (iv) ‘Map View’ of history samples. The air samples can be viewed by touching the pinpoint. (v) ‘List View’ of history samples. Each entry is a sample that shows the device name and capture time. (vi) View of one sample result. The ‘graph’ option shows a histogram of the particle sizing. (b) Work flow on the c-Air device. (c) Workflow on the server to support the processing of air samples. After the sample image and GPS location are sent to the server, the server processes the images through all five stages and saves the processed result. A copy of the result is sent to the smartphone app, where it is rendered and displayed. GPS, global position system; ML, machine learning.

