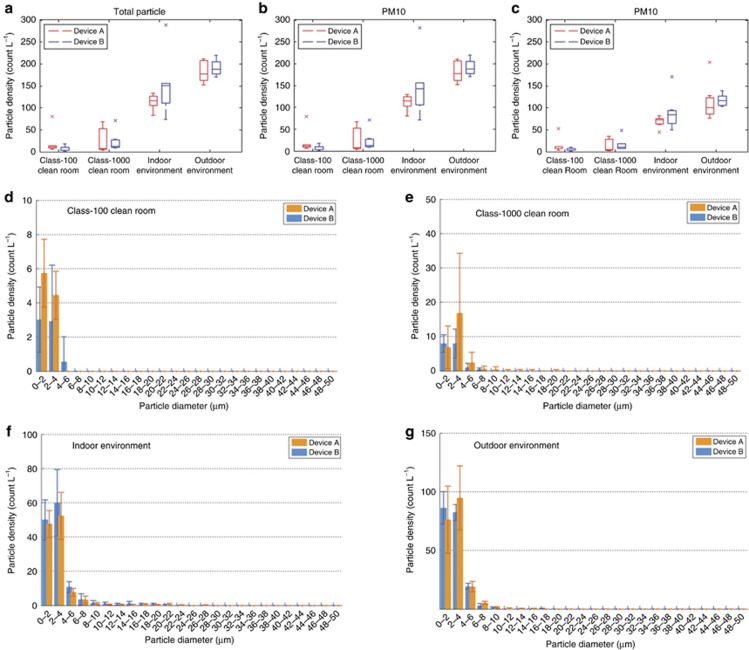
Figure 4.
c-Air repeatability tests at different locations. (a–c) Box-plot of the repeatability test results using two c-Air devices (A and B) at the (1) class-100 clean room of CNSI on 21 June 2016; (2) class-1000 clean room at CNSI on 23 May 2016; (3) indoor environment of the UCLA Engineering IV building on 25 May 2016; and (4) outdoor environment at the second floor patio of the UCLA Engineering IV building on 23 May 2016. The box-plot was generated using the box-whisker plot method with a whisker length of 1.5 (99.3% confidence) to exclude outliers, which are marked by the symbol ‘x.’ (d–g) Particle size and density distribution histogram comparison at each location: d Class-100 clean room; e class-1000 clean room; f indoor environment; and g outdoor environment. Seven samples for each c-Air device with a sampling period of 30 s were obtained at each location.

