. 2016 Jun 1;5(4):1216–1228. doi: 10.1039/c6tx00100a

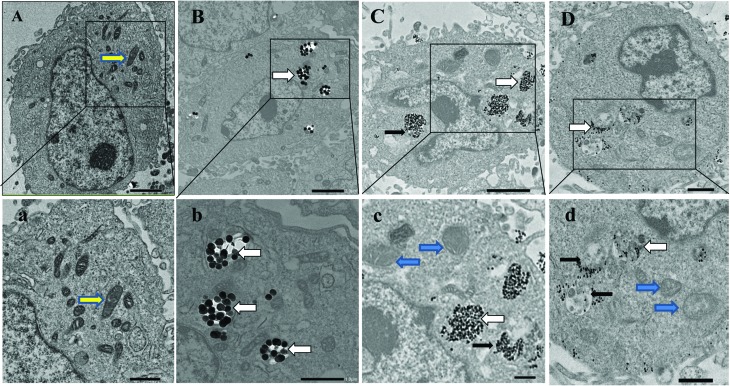
Fig. 4. TEM images of cellular uptake and autophagy induction for BEAS-2B cells exposed to the three sizes of silica particles using ultrastructural analysis. (A, a) Control group; (B, b) Si200; (C, c) Nano-Si60; and (D, d) Nano-Si40. Showing electron-dense silica particles dispersed in cytoplasm (white arrows). The magnification of the selected area shows evidently intact mitochondria (yellow arrows) in the control group, and mitochondrial swelling (blue arrows) induced by the Nano-Si60 and Nano-Si40 treated groups. The silica particles accumulated in autophagic vacuoles (black arrows) containing membrane-bound cytoplasmic material or degraded cytoplasmic materials. Scale bar: A, B, C, 2 μm; D, 1 μm; a, b, c, d, 1 μm.

Fig. 4