. 2016 Jul 19;5(5):1453–1464. doi: 10.1039/c6tx00236f

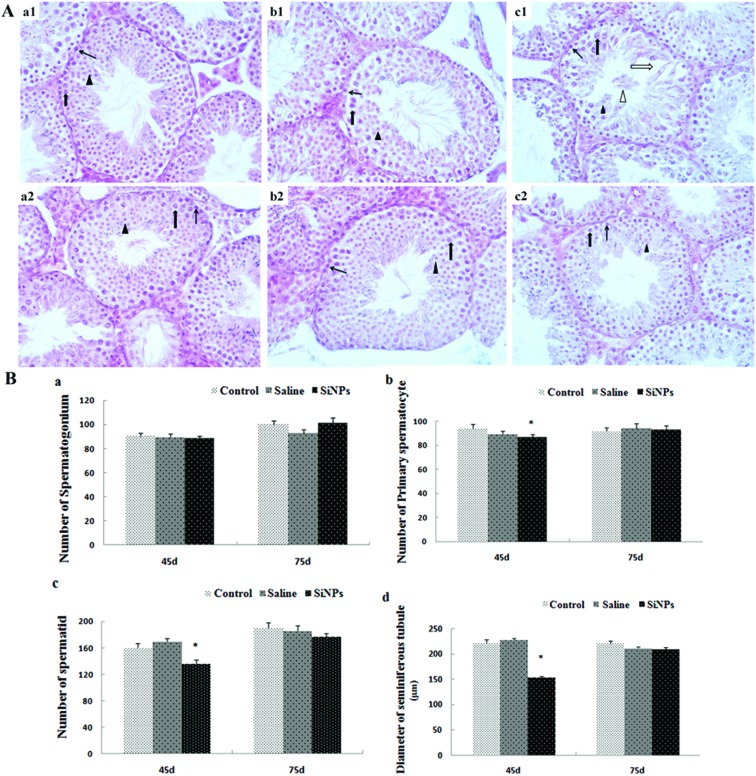
Fig. 2. Effects of silica nanoparticles on the structure of testicular tissue in mice A(a1–c2): 45 d (d is short for day) control group 400× (a1), 45 d saline group 400× (b1), 45 d SiNPs group 400× (c1); 75 d control group 400× (a2), 75 d saline group 400× (b2), 75d SiNPs group 400× (c2); thin black arrow represents spermatogonium; thick black arrow represents spermatocyte; black triangle represents spermatid; thick white arrow represents enlargement of gap. White triangle represents exfoliation of spermatogenic cells. (B) Numbers of spermatogenic cells and diameters of spermatogenesis tubules (Mean ± S.E.). *indicates significant difference compared to control and saline group (p < 0.05).

Fig. 2