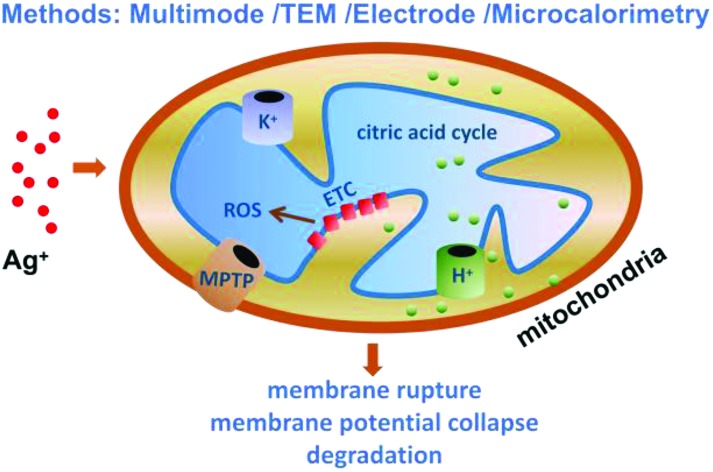
 Multiple methods are employed to reveal the effects and nonspecific mechanism of silver(i) ions on isolated mitochondria.
Abstract
Silver, once regarded as a safe noble metal for humans, has been widely used in industrial and commercial products, especially in nanometer biomaterials. It is now well known that Ag+ is biologically active and is able to interact with the cell membrane, proteins and DNA. However, very little is understood about the potential impacts of Ag+ at the sub-cellular level. Our work investigated the potential toxicity of Ag+ on mitochondria isolated from rat livers by examining the mitochondrial morphology, respiration, swelling, membrane fluidity and reactive oxygen species (ROS) generation. We observed that Ag+ significantly affects the mitochondrial structure and function, including mitochondrial swelling, collapse of the transmembrane potential, change of permeability and fluidity, decline of the respiratory rate, and acceleration of ROS, indicating that Ag+ should be seriously regarded as a potentially hazardous substance. Moreover, we conclude that Ag+ injures the mitochondrial structure and function by a nonspecific approach, in which the interaction is unregulated by inherent parts such as the mitochondria permeability transition pore (MPTP). These results help us learn more about the toxicity of Ag+ at the subcellular (mitochondrial) level and influence future biological and medical applications of Ag-based materials.
Introduction
Mitochondria are double membrane-enclosed organelles discovered in most eukaryotic organisms and described as “cellular power plants” due to their capability to generate adenosine triphosphate (ATP),1,2 which is the direct source of energy for cellular reactions and physiological activity. In addition to supplying bioenergy, mitochondria are involved in a series of vital processes, including cell necrosis and apoptosis, cellular differentiation, as well as the modulation of the cell cycle and growth.3 Due to their exquisite structures and implicated properties mitochondria are involved in many human diseases like Alzheimer's disease, traumatic brain damage, Parkinson's disease, stroke, myopathy, diabetes, multiple endocrinopathy and a variety of other systemic manifestations.4–8 Maria Manczak and her colleagues have reported that mitochondria are a direct site of Aβ accumulation in neurons in Alzheimer's disease,9 indicating a much crucial role of mitochondria in excitotoxic neuronal death.
It is generally accepted that the mitochondrial permeability transition (MPT) is because of the opening of large nonspecific pores, causing increased permeability to solutes and molecules with masses up to 1500 Da.10 For this reason, mitochondria undergo osmotic swelling, collapse of the transmembrane potential, efflux of matrix components, and at an extreme level, rupture of the membrane. Although the molecular nature of mitochondrial permeability transition pores (MPTP) is unknown, many studies demonstrate that MPT is a key event during both necrosis and apoptosis.7 A current model suggests that MPTP form a bridge connecting the inner and outer mitochondrial membrane by association of the voltage-dependent anion channel (VDAC) in the outer membrane, the adenine nucleotide translocator (ANT) in the inner mitochondrial membrane (IMM), cyclophilin D (CypD) in the matrix and other components.11,12 In spite of the intimate connection between MPT and Ca2+, it has been revealed that the MPT can also take place in the absence of Ca2+.13 Similarly, the inhibition of the MPT by CsA,14,15 a classical inhibitor of MPT by binding to CypD, can be transitory or ineffective in some specific conditions. According to our experimental findings, Ag+ affects the mitochondrial structure and function without relying on Ca2+ or being blocked by CsA. Therefore, we concluded that AgNO3 damages mitochondria through a MTP-insensitive approach.
Reactive oxygen species (ROS), 90% of which are generated because of mitochondrial metabolism and oxidative phophorylation, are closely linked to degenerative diseases, aging and cancer.4,6 As a byproduct of oxidative phosphorylation, steady streams of reactive species emerge from the mitochondria and potentially cause damage to all cellular components including the membrane, nuclei, cytoplasm and organelles. Structure alteration, biomolecule fragmentation, and oxidation of side chains are downstream from cellular energy production. Inexhaustive scavenging of ROS results in the activation of cytosolic stress pathways, DNA damage, affects the mitochondrial lipid cardiolipin, triggers the release of mitochondrial cytochrome c, and activates the intrinsic death pathway, namely cell apoptosis.16–18 One of the follow-up events caused by ROS is lipid peroxidation, potentially resulting in the alteration of mitochondrial structures and the impairment of mitochondrial function. Mitochondria possess abundant polyunsaturated fatty acids which account for about 80% of the total phospholipids and are vulnerable to the attacks by ROS in the presence of Fe2+.19,20 In isolated mitochondria, low concentrations of Fe2+ give rise to a rapid burst of O2 uptake after a short relaxation and lipid peroxidation comes to an end when Fe2+ is depleted.20 Also, this phenomenon is accompanied by a large amplitude swelling.
Generally speaking, ROS, lipid peroxidation, Ca2+ and MPT share mutual regulation and control but do not occur independently. However, when interacting with Ag+, a violent intruder, mitochondria will be damaged rapidly and tempestuously without following the usual channels.
Silver, which was once regarded as a safe metal, has been put to use as decorations, food containers or purifying agents for over 2000 years. It has also been increasingly used in industrial and commercial products, especially in nanoscale biomaterials.21 However it has been increasingly reported that Ag is detrimental to organisms especially in the form of free ions.22–30 To figure out its adverse effects we investigated the mitochondrial performance in the presence of Ag+.
So far, most research studies about the toxicity of silver have focused on the cellular, protein and DNA levels.17–21,29,30 To our knowledge, the effects of silver at the subcellular level are rarely investigated. In the present study, we investigated the effects of silver ions on mitochondria by spectroscopy, the oxygen consumption method, transmission electron microscopy and microcalorimetry. We measured the swelling of mitochondria, by ultraviolet spectroscopy, the fluidity of the membrane, the membrane potential and ROS generation by fluorescent spectrometry, O2 consumption and lipid peroxidation by a Clark electrode,31,32 and the morphology of mitochondria by transmission electron microscopy (TEM). The results show that the silver ion influences the mitochondrial structure and function. It exhibits a certain toxicity to mitochondria at a slightly higher concentration. We found that Ag+ induces mitochondrial swelling, thus causing the collapse of the mitochondrial membrane potential and inhibiting respiration. Moreover, the destruction of mitochondria by Ag+ does not depend on Ca2+ or any specific pathways. Based on these results, we concluded that Ag+ damages mitochondrial function by a nonspecific approach.
Experimental
Animals
Female Wistar rats were purchased from the Hubei Center for Disease Control and Prevention (Wuhan, China), and housed in ventilated micro-isolator cages with free access to water and food in a temperature-controlled room (22 ± 2 °C). Rats weighing 130–150 g were used to isolate the liver mitochondria. Animals were handled according to the Guidelines of the China Animal Welfare Legislation, as approved by the Committee on Ethics in the Care and Use of Laboratory Animals of the College of Life Sciences, Wuhan University.
Chemicals and materials
Cyclosporin A (CsA), 2′,7′-dichlorodihydrofluorescin diacetate (DCFH-DA), EGTA, oligomycin, rhodamine 123 (Rh123), hematoporphyrin (HP), ruthenium red (RR), monobromo(trimethylammonio)bimane bromide (MBM+) and dithiothreitol (DTT) were purchased from Sigma–Aldrich Corp. (St Louis, MO, USA). All other reagents were of analytical reagent grade.
Instrument
All centrifugations for the extraction of mitochondria were run on a TGM-20 high-speed freezing centrifuge (Xiangyi, Changsha, China). The ultrastructure of mitochondria was observed by using a JEM-100CX II transmission electron microscope (JEOL, Tokyo, Japan). The absorption of mitochondria at 540 nm was measured on a UV-6 100PC double beam spectrophotometer (MAPADA, Shanghai, China) while the alteration of fluorescence and anisotropy were tested by using an LS-55 fluorophotometer (PerkinElmer, Norwalk, CT). The respiration and lipid peroxidation of mitochondria were measured by using a Clark-type oxygen electrode (Oxygraph, Hansatech, UK). The reaction of O2 consumption in response to the electrode is written ultimately as follows:
| Ag electrode: 4Ag + 4Cl– → 4AgCl + 4e | 1 |
| Pt electrode: O2 + 2H2O + 4e → 4OH– | 2 |
The real-time heating test relied on a microcalorimeter (TAM III, TA Instruments, USA), which displayed high performance in precision and sensitivity and supported 6 channels simultaneously. Glass ampoule bottles covered with copper caps were used in our experiments due to their lack of disturbance compared to metal ones.
Solution preparation
Five buffers used in this study were prepared as follows:33–35 Buffer A (220 mM mannitol, 70 mM sucrose, 20 mM HEPES, 2 mM Tris-HCl, 1 mM EDTA); Buffer B (220 mM mannitol, 70 mM sucrose, 5 mM Tris-HCl, 1 mM EDTA); Media C (70 mM sucrose, 220 mM mannitol, 1 mM EDTA); Buffer H (135 mM potassium acetate, 5 mM HEPES, 0.1 mM EGTA, 2 μM rotenone, 1 μg mL–1 valinomycin, 0.2 mM EDTA); Buffer K (135 mM KNO3, 5 mM HEPES, 0.1 mM EGTA, 2 μM rotenone, 0.2 mM EDTA). The pH values of all the buffers were adjusted to 7.2–7.4.
CsA, oligomycin, rotenone, Rh123 and HP were dissolved in anhydrous ethanol. DCFH-DA was dissolved in DMSO and then diluted in ethanol. And all the other stock solutions were prepared with sterile double-distilled water acquired from a water purification system (Simplicity, Millipore Corp, Billerica, MA).
Isolation of mitochondria
Liver mitochondria from female Wistar rats (130–150 g) were isolated and purified through multiple centrifugations.36 Rat liver tissue was cut into pieces and homogenized with a set of Dounce Tissue Grinders (Wheather)37 in Buffer A. 0.4% (g mL–1) BSA was added to Buffer A before homogenization. Homogeneous fluid was centrifuged at 1000g for 3 min. Then the supernatant was recentrifuged at 10 000g. In this step, the supernatant was discarded and the precipitate was suspended in Buffer A. The fourth centrifugation was conducted under the same conditions as Step three after changing Buffer A to Buffer B. All the above operations were performed at 0–4 °C. Finally the mitochondria-rich pellet was suspended in Media C for further experimentation.
Mitochondrial protein concentration was calculated by the biuret method, using serum albumin as the standard.38 All the concentrations of mitochondria mentioned below were in fact the concentrations of proteins rather than the amount of mitochondria themselves.
Mtiochondrial ultrastructure by a TEM
After suspending mitochondria in Media C the solution was incubated for 5 min at 30 °C and instantly centrifuged at 10 000g. The precipitate was fixed for 30 min at 4 °C using glutaraldehyde with a final concentration of 2.5% in phosphate buffer saline, then post-fixed with 1% osmium tetroxide and dehydrated.39
Mitochondrial swelling and IMM permeability
The absorbance of mitochondria at 540 nm was recorded by using a UV–vis spectrophotometer immediately after injecting Ag+ into mitochondrial suspension.40 When needed, protective agents including CsA, MBM+, and DTT would be added in advance.
The permeability of the mitochondrial inner membrane to H+ and K+ was also tested by the same method as swelling. The mitochondrial inner membrane permeability to H+ was measured in Buffer H and that to K+ was measured in Buffer K.
Membrane potential, fluidity and ROS release
Mitochondrial transmembrane potential (Δψ) was monitored by the changes of the fluorescence intensity of Rh123 (ex: 488 nm; em: 535 nm; 100 nM). A mitochondria-rich pellet (0.5 mg mL–1) was suspended in Media C for analysis, as well as for all the subsequent experiments. As for the mitochondrial membrane fluidity, the anisotropy of HP-labeled (ex: 520 nm; em: 626 nm; 0.6 μM) mitochondria was detected with a magnetic stirrer which was kept on at all times. The ascent rate of fluorescence of DCFH-DA (ex: 488 nm; em: 525 nm; 250 nM) indicated ROS generation of mitochondria. The temperature for these three experiments was kept at 25 °C at all times.
Oxygen consumption and lipid peroxidation
Mitochondrial respiration was measured using a Clark oxygen electrode. A mitochondrial (0.5 mg mL–1) suspension was added to 1 mL of Media C at 30 °C in a sealed chamber equipped with a magnetic stirrer. Oxygen consumption of both State 3 (in the presence of 5 mM succinate and 4 mM ADP) and State 4 (only 5 mM succinate) was detected. The respiratory control ratio (RCR) was expressed as the ratio of State 3/4 activity. Different concentrations of AgNO3 were added to the chamber following mitochondria.
Similar to the respiratory experiment, the measurement of lipid peroxidation was carried out by the Clark oxygen electrode and evaluated by O2 consumption. Lipid peroxidation was initialed when 1 mM ADP/0.1 mM Fe2+ was injected into a mitochondrial (0.5 mg mL–1) suspension in the sealed chamber.
Activity of complex II
The activity of mitochondrial complex II was assayed by measuring the reduction of MTT. Briefly, 100 μL of mitochondrial suspension (0.5 mg mL–1) was incubated with AgNO3 at 37 °C for 15 min; then 0.4% of MTT was added to the mitochondria and the suspension was incubated at 37 °C for 30 min. The product formazan crystals were completely dissolved in 200 μL of DMSO, and the absorbance at 570 nm was measured with a multimode plate reader.
Mitochondrial metabolism by TAM III
Isolated mitochondria were incubated in Media C at 0 °C for 8 h and then were pipetted into ampules. The total volume in each ampule was 1 mL and the concentration of mitochondria was 3.5 mg mL–1. The running temperature was stabilized at 30 °C.
Interaction between Ag+ and DTT
The interaction between Ag+ and DTT was carried out with a UV–vis spectrophotometer. Ag+ was titrated into DTT solution and the reverse titration was done too. The changes of peak position and intensity were recorded to identify the interaction.
Results and discussion
The activity of isolated fresh mitochondria was characterized with the Clark oxygen electrode. Only the mitochondrial activity with RCR values that are close to three can be accepted.41 All of the isolated mitochondria meet the requirement.
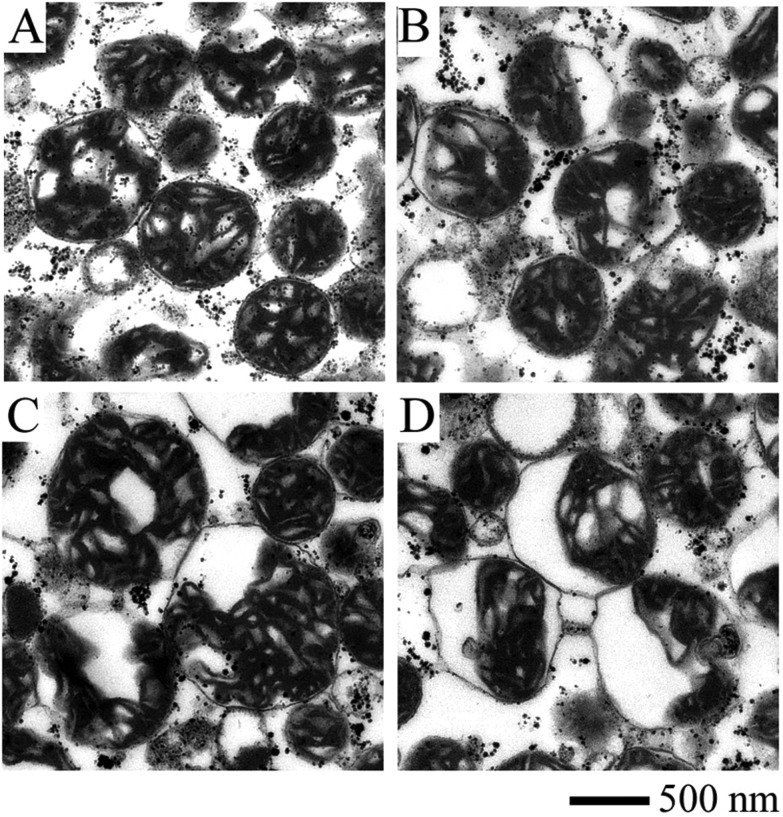
Fig. 1 displays the ultrastructure of mitochondria affected by Ag+. The integrity of the outer and inner mitochondrial membrane and the internal structure is maintained after the mitochondria are isolated from rat liver (Fig. 1A). Mitochondria incubated with 2 and 10 μM Ag+ (Fig. 1B and C) are obviously swollen, with a decreased matrix electron density. The separation between the outer and inner membrane is clearly observed with the addition of 50 μM Ag+. These results indicate that Ag+ is able to damage the structure of the mitochondrial membrane.
Fig. 1. Ultrastructure images of mitochondria incubated with varied concentrations of Ag+ measured by TEM. (A) Control, the compact inner membrane and distinguishable cristae indicate that fresh mitochondria isolated from rat liver were intact in structure. (B) 2 μM Ag+, an obvious matrix swelling took place. (C) 10 μM Ag+, the swelling aggravated and there was a remarkable separation between the outer and inner membrane. (D) 50 μM Ag+, mitochondria were badly damaged.
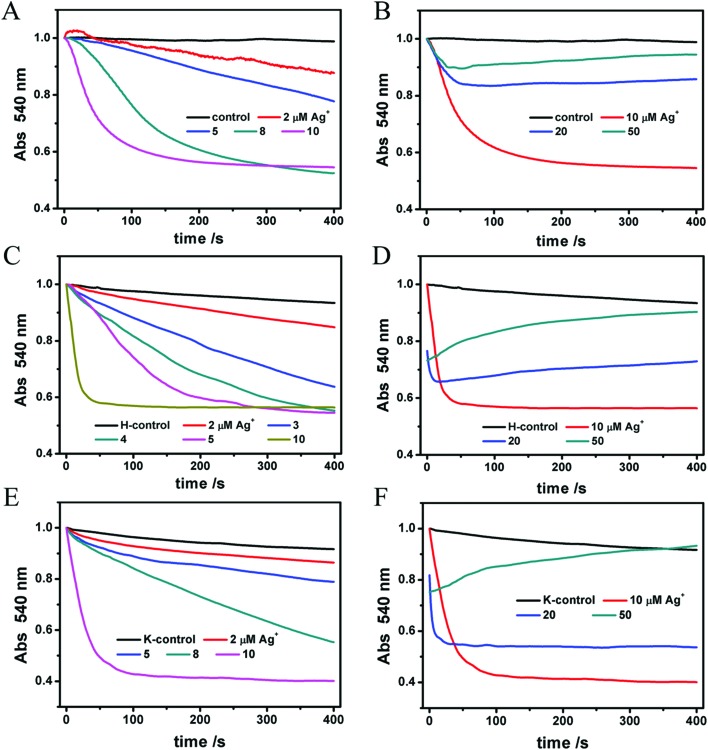
On the other hand, mitochondrial matrix swelling indicates their structure change. The mechanism of mitochondrial swelling is described as follows: incremental mitochondrial inner membrane permeability to solutes and ions results in the collapse of the membrane potential and subsequent water accumulation, thus causing mitochondrial swelling. As mitochondria become more and more transparent, the absorbance signals collected by the instrument become lower and lower. Ag+ at lower concentrations (2–10 μM) causes a reduced absorbance markedly (Fig. 2A). However, the curves of 20 and 50 μM of Ag+ (Fig. 2B) totally differ from the curves of lower concentrations where a fall-and-rise phenomenon takes place. Certainly, we don't consider it as a protective effect. On the contrary, we regard it as a more severe damage to the mitochondria where it no longer expands and instead it shrinks due to a partial rupture, similar to a balloon. We infer that a high level of Ag+ gives rise to a drastic rupture of the membrane structure. In brief, Ag+ induces mitochondrial swelling in a dose-dependent method.
Fig. 2. (A, B) Mitochondrial matrix swelling induced by various concentrations of Ag+. The absorbance at 540 nm of mitochondria declines with swelling. (C–F) The penetrability of the inner membrane to H+ and K+ in the presence of Ag+ reflected the mitochondrial swelling.
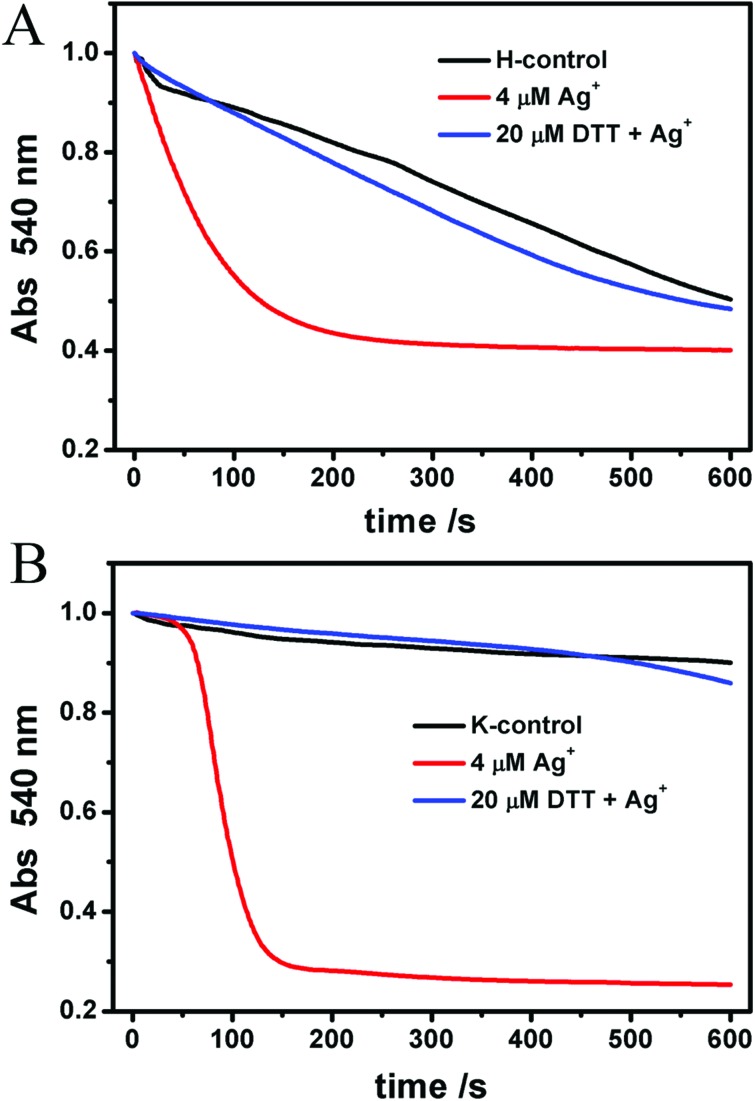
We also investigated the penetrability of the inner mitochondrial membrane to H+ and K+ to find out how Ag+ damaged mitochondria. NO3– is free from inner membrane selectivity, so it is the accumulation of K+ that determines whether mitochondria swell or not. That's why we chose KNO3 as a component of Buffer K. In the case of Buffer H, valinomycin, a liposoluble K+ carrier, removes the block of K+ so that the contribution of K+ is excluded; meanwhile CH3COOH crosses the inner membrane and dissociates into CH3COO– and H+ in the matrix, producing a H+ gradient which impairs mitochondrial swelling.42,43 In Fig. 2C–F, violent swelling occurs in both Buffer H and Buffer K, and the trends are totally the same as in Media C. Here we attribute the swelling not to the penetrability of the inner membrane to H+ or K+ simply but to a general destruction caused by Ag+. The reason will be discussed below.
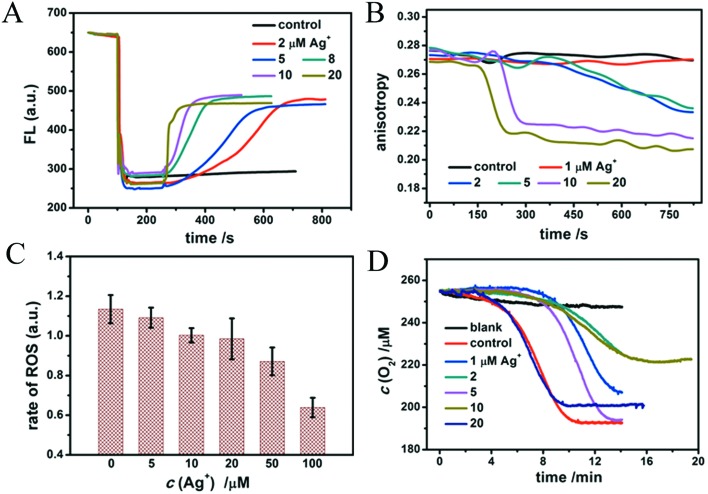
In order to study the effects of different doses of Ag+ on isolated mitochondria, we investigated the mitochondrial structure and function change induced by Ag+. The mitochondrial membrane potential was measured by testing the fluorescence intensity of Rh123, a liposoluble and positively charged dye which is able to pass through the inner mitochondrial membrane smoothly due to the potential gradient between the inside and outside of the inner membrane.44 This leads to Rh123 accumulation in the mitochondrial matrix and to the depression of fluorescence intensity. Whenever an agent contracts the potential difference, Rh123 will move out of the mitochondrial matrix, leading to a rise of the fluorescence intensity. As a liposoluble and positively charged fluorescence reagent, Rh123 permeates easily through the inner mitochondrial membrane driven by the membrane potential. The fluorescence intensity decreases obviously after Rh123 is swallowed by mitochondria and partly rises again after Rh123 flows out of the membrane, as shown in Fig. 3A. The figure also clearly shows that Ag+ leads to a rapid and violent collapse of the membrane potential, which is dose-dependent. 20 μM Ag+ causes an immediate breakdown of the membrane potential, therefore we inferred that it is highly toxic to mitochondria. An interesting phenomenon is that the fluorescence of Rh123 will neither completely disappear after adding mitochondria nor completely revert after adding Ag+.
Fig. 3. Mitochondrial membrane function change. (A) The fluorescence intensity of Rh123 (100 nM) reflects the status of the mitochondrial membrane potential. (B) Effects of different concentrations of Ag+ on the anisotropy changes of HP-labeled mitochondria. (C) Ag+ slows down mitochondrial ROS generation. 250 nM of DCFH-DA was altered to measure the rate of ROS generation. (D) Mitochondrial lipid peroxidation in the presence of Ag+. Blank: Mitochondria without inducer consume little O2. Control: 1 mM ADP/0.1 mM Fe2+ induce the mitochondrial lipid peroxidation manifesting as a short relaxation time and rapid O2 expenditure.
Several experiments have manifested this result.35,45–47 In our opinion, the exciting light is able to track down Rh123 even if it is entirely taken up by mitochondria. As for the incomplete rebounding of the fluorescence intensity, we infer that only part of Rh123 effluxes out of mitochondria. Another reason may be that mitochondria changes the clear solution into a turbid one thereby lessening the fluorescence signals.
The membrane fluidity of HP-labeled mitochondria was evaluated by changes in the fluorescent anisotropy (r).35 HP is reported to interact with polar and solvent-accessible regions of the lipid bilayer and with protein sites in biological membranes.48 The lower the anisotropy, the more flexible the membrane. As observed in Fig. 3B, the anisotropy of HP labeling on mitochondria declines after the addition of Ag+, demonstrating that the fluidity of the membrane is enhanced with increasing amounts of Ag+. This is probably due to the loosening of the membrane structure and the increasing fluidity.
We have known that the mitochondrial respiratory chain is the main site of ROS generation, among which complex I and complex III are responsible for the highest production of ROS.49 ROS then triggers the peroxidation of polyunsaturated fatty acids in the presence of Fe2+. The revelation of ROS generation is significant to study respiratory dysfunction. A non-fluorescent dye, DCFH-DA, was used to detect the level of ROS, which is easily hydrolyzed by esterase in the matrix to DCFH. Non-fluorescent DCFH is vulnerable to the attacks by ROS and fluorescent DCF is produced, by which we judge how much ROS is generated in the process.49 As shown in Fig. 3C, Ag+ slows down the rate of ROS generation gradually, depending on concentrations. And in Fig. 4D, Ag+ decelerates the rate of lipid peroxidation and cuts down the total O2 expenditure. As mentioned above, ROS that is responsible for senility and many diseases is mostly produced in mitochondria, along with electron transfer and oxidative phosphorylation. The rate of ROS generation is rationally attenuated because of the breakdown of the mitochondrial membrane, the collapse of the transmembrane potential and the following recession of electron transfer. Hence, the relaxation of lipid peroxidation and the decrease of O2 expenditure correspond to the slowness of ROS generation, and prove the preceding findings. These results further explain the toxicity of Ag+ to mitochondria.
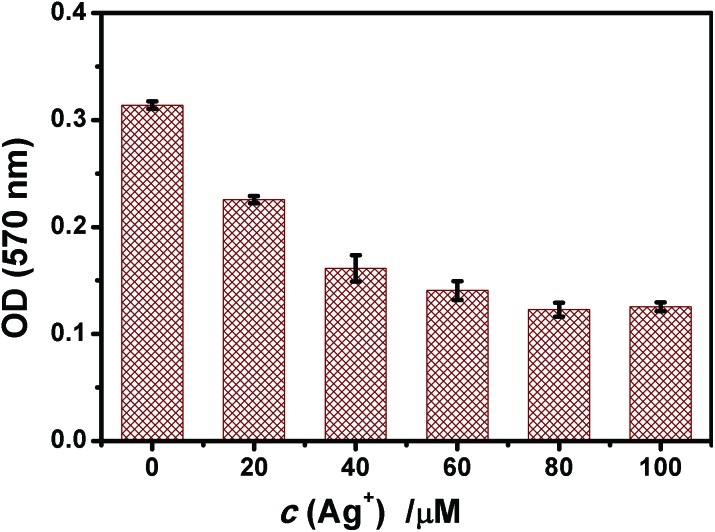
Fig. 4. Ag+ affected the activity of the respiratory chain complex II detected by the MTT assay. Mitochondria were incubated with Ag+ for 15 min prior to the measurement. The value of OD reflected complex II activity.
Table 1 shows that Ag+ inhibits the O2 consumption as a whole. Respiration is a very important function of mitochondria, aiming at transporting electrons and synthesizing ATP for physiological action. So Ag+ weakening the process indicates a destructive effect on mitochondrial function. In State 3, succinate as the substrate of complex II and ADP as the substrate of ATPase were added in order to ensure the respiratory chain in an active state, while Ag+ firmly stops this process showing that it probably inhibits the activity of ATPase.
Table 1. The rate of O2 consumption in three respiratory states at various concentrations of Ag+.
| Ag+ (μM) | State 4 (μM min–1) | State 3 (μM min–1) | RCR |
| 0 | 16.28 ± 0.81 | 47.36 ± 1.48 | 2.91 ± 0.16 |
| 5 | 18.63 ± 1.10 | 44.58 ± 1.96 | 2.40 ± 0.24 |
| 10 | 20.92 ± 1.26 | 37.28 ± 2.80 | 1.78 ± 0.05 |
| 20 | 26.30 ± 1.16 | 28.57 ± 2.21 | 1.09 ± 0.11 |
| 40 | 8.78 ± 0.43 | 12.48 ± 0.74 | 1.43 ± 0.15 |
Fig. 4 shows that after 15 min of incubation of mitochondria with Ag+, a concentration-dependent decrease of A570 appeared and the activity of succinate dehydrogenase (complex II) was reduced. The results correspond to the inhibition of mitochondrial respiration by Ag+.
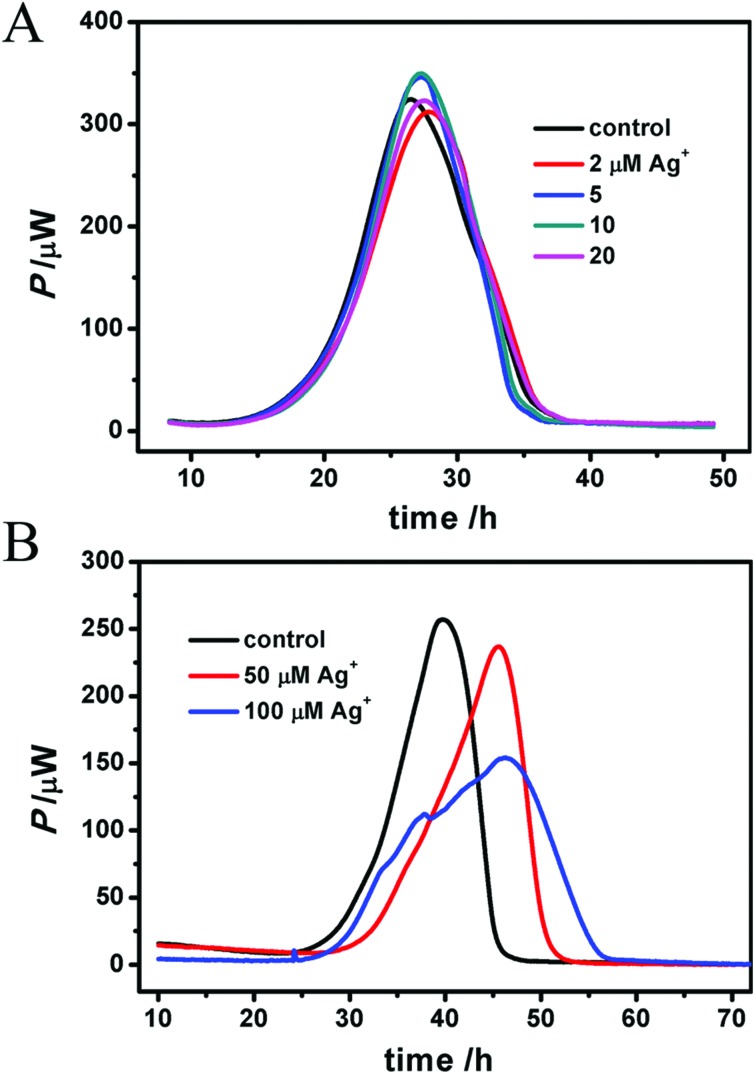
Moreover, a long-term, real-time heat release was detected by microcalorimetry as shown in Fig. 5 where a high concentration of Ag+ (50, 100 μM) inhibits the mitochondrial metabolism by delaying the tmax and decreasing the Pmax. The thermodynamic parameters are listed in Table 2. Lower concentrations make no difference in heat rate (P) or peak time (t), which is probably due to the larger amount of mitochondria (3.5 mg mL–1) here, much more than 0.5 mg mL–1 during other tests. Given the real-time and long-term monitoring, this result convincingly reveals the destructive effect of Ag+ on mitochondria.
Fig. 5. Real-time heat detection of mitochondria by microcalorimetry. A low concentration of Ag+ (2–20 μM) has little impact on mitochondria (3.5 mg mL–1) (A), while higher concentration (50 and 100 μM) does obviously inhibit caloric metabolization, decreasing the pmax, decelerating the heat release and delaying the tmax (B). However the total heat (Q) doesn't change much because of a certain amount of air in the ampoules.
Table 2. The thermodynamic parameters of mitochondrial heat metabolism. Q is the total heat release, tmax is the peak time, Pmax is the maximum heat power, k1 is the growth rate constant and k2 is the attenuation rate constant.
| Ag+ (μM) | Q (J) | t max (h) | P max (μW) | k 1 (h–1) | R12 | k 2 (h–1) | R22 |
| 0 | 9.10 | 39.81 | 256.88 | 0.229 | 0.9987 | –0.577 | 0.9288 |
| 50 | 9.10 | 45.54 | 236.77 | 0.137 | 0.9917 | –0.634 | 0.9569 |
| 100 | 9.41 | 46.45 | 153.79 | 0.063 | 0.9270 | –0.163 | 0.9590 |
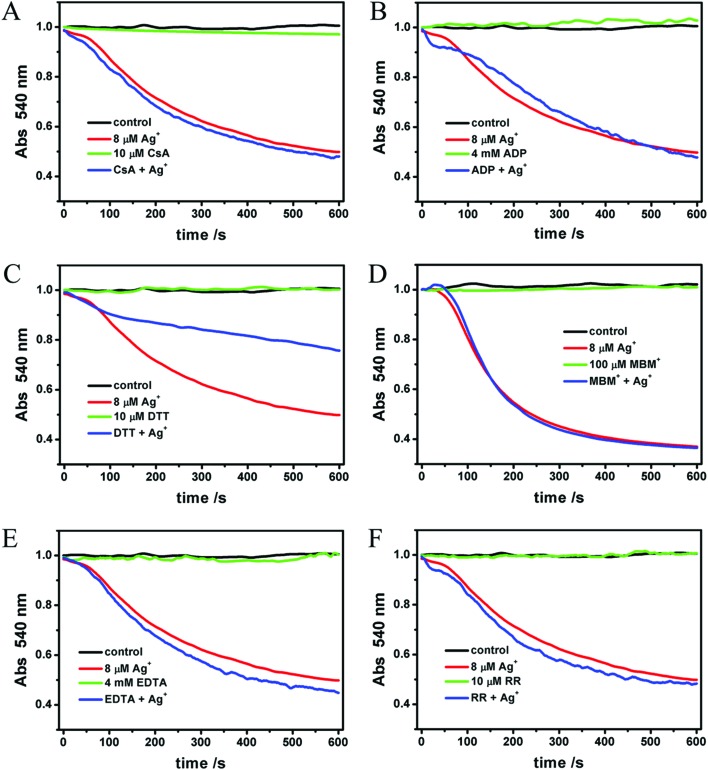
In order to confirm the mechanism and the binding site of Ag+ on mitochondria, we evaluated the inhibiting effects of ADP, EDTA, CsA, RR, DTT and MBM+ on Ag+-induced swelling. As we all know, the opening of MPTP leads to mitochondrial swelling and collapse of the membrane potential directly. On the other hand, the opening of MPTP is not the only factor that induces swelling and collapse of the membrane potential. CsA is a classical inhibitor of MPTP, which prevents the interaction of CypD and ANT.50 Although the structure of MPTP, a protein channel linked to the inner mitochondrial membrane, has not yet been defined, CsA is considered to be a well established inhibitor by combining with CypD.11,12 In Liu's experiments where Zn2+ acts on mitochondria, CsA entirely inhibits the Zn2+-induced swelling. ADP is the next most effective agent for preventing MPT by combining with ANT.11 EDTA, a well known chelator, is able to combine with Ca2+, Ag+ and many other metal ions. Ruthenium red (RR), a non-competitive inhibitor of the mitochondrial Ca2+ uniporter, has been shown to inhibit several mechanisms involved in intracellular Ca2+ regulation.51 MBM+ is a selective thiol reagent, which prevents MPTP opening caused by some dithiol oxidants or cross-linkers. As reported, it is impermeable to the mitochondrial inner membrane.39 Similar to MBM+, DTT also prevents the MPTP opening caused by the oxidation of –SH.42 In contrast to MBM+, it is permeable to the inner membrane. In other words, DTT is able to protect S-sites which are localized on the matrix side of the inner membrane.
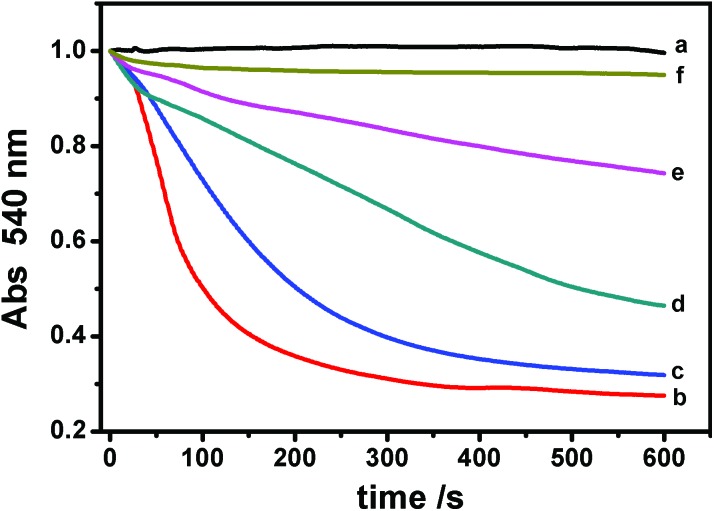
As shown in Fig. 6A–F, all of these agents themselves make no impact on mitochondrial swelling. The addition of Ag+ after one of the protective agents showed that Ag+-induced mitochondrial swelling is not affected by ADP, CsA, EDTA, MBM+ or RR (Fig. 6A–E). However, 10 μM DTT partly blocks the swelling induced by Ag+ (Fig. 6F). To shed light on the mechanism, different concentrations of DTT were then tested. We find that the protective effect of DTT is dose-dependent (Fig. 7). Mitochondrial swelling doesn't even occur; also the control at a DTT concentration increased to 40 μM, indicating that the mitochondrial swelling can be totally reversed by DTT. Furthermore, the effects of DTT on Ag+-induced swelling are non-linear. It is not surprising that EDTA doesn't have an effect, and the possible reason is that the chelation between EDTA and Ag+ is weak at pH 7.2, in spite of its higher concentration compared to Ag+. The DTT-protected IMM permeability to H+ and K+ was also observed, as shown in Fig. 8.
Fig. 6. Effects of different agents (A) 10 μM CsA, (B) 4 mM ADP, (C) 10 μM DTT, (D) 0.1 mM MBM+, (E) 4 mM EDTA and (F) 10 μM RR on the Ag+-induced swelling of mitochondria. The protective reagents were incubated with mitochondria for 2 min prior to Ag+.
Fig. 7. Protective effects of different concentrations of DTT on the Ag+-induced mitochondrial swelling. (a) Control; (b) 8 μM Ag+; (c) 5 μM DTT and Ag+; (d) 10 μM DTT and Ag+; (e) 20 μM DTT and Ag+; and (f) 40 μM DTT and Ag+.
Fig. 8. The protective effects of DTT on the Ag+-induced IMM permeability decline to H+ and K+. Mitochondria were incubated with 20 μM DTT for 2 min prior to 4 μM Ag+.
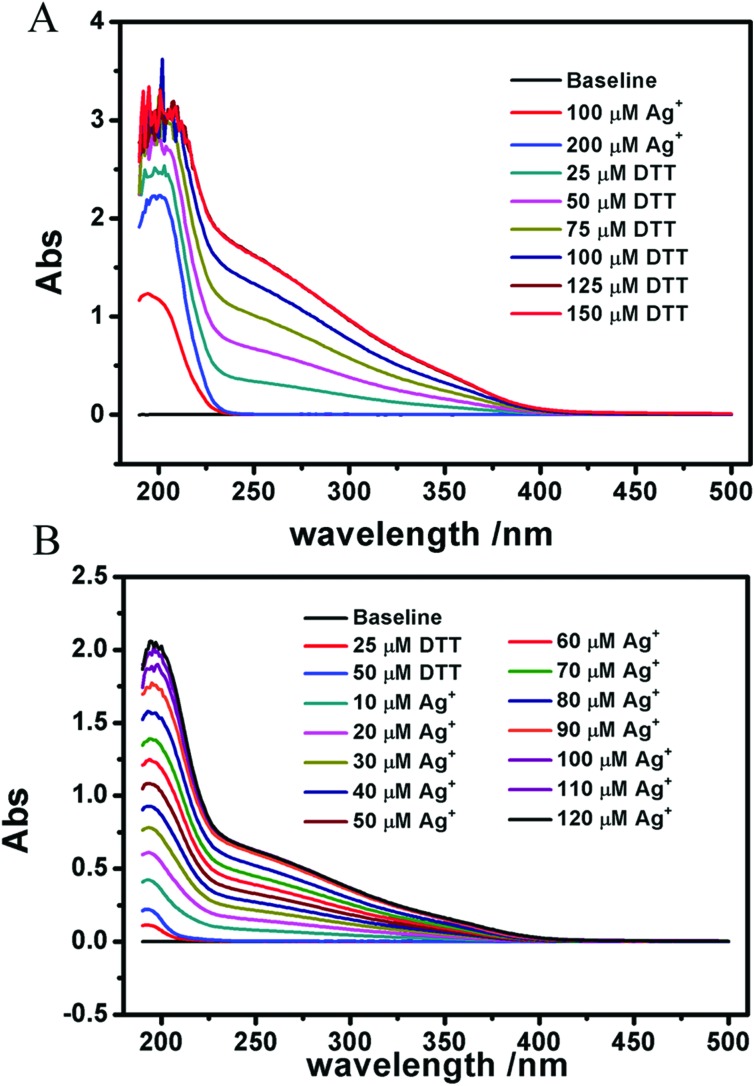
We measured the reaction between Ag+ and DTT by using a UV spectrophotometer (Fig. 9). It indicates that Ag+ can indeed react with DTT, and the complex proportion of Ag+ to DTT is 2 : 1. As shown, none of the six agents above can protect Ag+-induced swelling. This indicates that a different mechanism is responsible for mitochondrial dysfunction induced by Ag+, instead of the opening of MPTP. A more likely explanation is that the interaction of Ag+ on mitochondria is nonspecific.
Fig. 9. The interaction between AgNO3 and DTT clarified by a UV–vis spectrophotometer. (A) DTT was titrated to 200 μM Ag+. (B) Ag+ was titrated to 50 μM DTT.
Based on the uninfluenced action of these protective drugs on Ag-induced mitochondrial dysfunction in structure and function, the MPT pathway and the coefficient with Ca2+ are excluded in studying the mechanism of Ag+ behavior. Given the extremely high activity of Ag+, we infer that Ag+ attacks mitochondria through a nonspecific way by attacking any structure it encounters and ultimately results in the collapse of mitochondria. Due to its nonspecific activity, Ag+ attacks lipids, proteins and thiols in mitochondria and results in membrane rupture, which is corresponding to its effects on the cellular membrane. From published papers, we conclude that free Ag+ can cause lipid peroxidation in the cellular membrane and cell leakage, which subsequently brings disasters to cells.52 However, in our research, Ag+ inhibits lipid peroxidation because in isolated mitochondria, it rapidly breaks respiration and reduces the ROS level, which is regarded as the reason for lipid peroxidation. In general, the actions of Ag+ on both the cellular membrane and mitochondrial membrane are based on the same principle.
In summary, Ag+ is harmful to organisms according to our results although the in vivo experiments couldn't completely simulate the conditions in vivo. Some researchers believe that the toxicity of Ag nanoparticles definitely comes from the release of Ag+.53 Most of our in vivo experimental systems last for only a short period of time, considering the activity of isolated mitochondria. In vivo details such as uptake, location, accumulation and expulsion are not that distinct because of the complicated mitochondrial system and cellular communication. The biofeedback takes a long time, several months to many years, and probably a long-term accumulation process when invaded by Ag+; therefore the biosecurity of Ag involved drugs and controlled release must be taken seriously.
Conclusions
Mitochondria, associated with ROS generation, cyt-c release, apoptosis and necrosis, aging and neurodegenerative diseases, play a quite vital role in cell metabolism. MPT, which might occur both in the presence and absence of Ca2+, is a key mechanism for cell apoptosis regulated by mitochondria. Our results collected from isolated mitochondria show that Ag+ damages the mitochondrial membrane and induces mitochondrial swelling, promotes membrane fluidity, collapses the membrane potential, and slows down ROS generation and lipid peroxidation, via a non-specific approach instead of a certain one (such as MPTP or Ca2+-related regulation). Our study provides a theoretical basis for the nanobiological effects of Ag-associated materials, like Ag-doped quantum dots and Ag nanoclusters, etc. In spite of the different environments associated with in vivo and in vitro studies, the release of Ag ions in the medical and biological applications of Ag-related materials should be scrupulously monitored.
Conflict of interest
There are no conflicts of interest to declare.
Acknowledgments
The authors gratefully acknowledge the financial support from the National Science Fund for Distinguished Young Scholars of China (Grant No. 21225313), the National Natural Science Foundation of China (Grant No. 21473125), the Hubei Natural Science Foundation of China (No. 3014CFA003), the Fundamental Research Funds for the Central Universities (No. 2042014kf0287), and the Wuhan Yellow Crane Talents of Science and Technology Plan.
References
- Scheffler I. E. Mitochondrion. 2001;1:3–31. doi: 10.1016/s1567-7249(00)00002-7. [DOI] [PubMed] [Google Scholar]
- Tian Y. RSC Adv. 2013;3:708–712. [Google Scholar]
- Deckwerth T. L., Johnson E. M. J. Cell Biol. 1993;123:1207–1222. doi: 10.1083/jcb.123.5.1207. [DOI] [PMC free article] [PubMed] [Google Scholar]
- Tillement L., Lecanu L., Papadopoulos V. Mitochondrion. 2011;11:13–21. doi: 10.1016/j.mito.2010.08.009. [DOI] [PubMed] [Google Scholar]
- Liu X. R., Beugelsdijk A., Chen J. H. Biophys. J. 2015;109:1049–1057. doi: 10.1016/j.bpj.2015.07.043. [DOI] [PMC free article] [PubMed] [Google Scholar]
- Li X. J., Orr A. L., Li S. H. Biochim. Biophys. Acta. 2010;1802:62–65. doi: 10.1016/j.bbadis.2009.06.008. [DOI] [PMC free article] [PubMed] [Google Scholar]
- Crompton M. Biochem. J. 1999;341:233–249. [PMC free article] [PubMed] [Google Scholar]
- Bossy-Wetzel E., Talantova M. V., Lee W. D., Schölzke M. N., Harrop A., Mathews E., Götz T., Han J., Ellisman M. H., Perkins G. A., Lipton S. A. Neuron. 2004;41:351–365. doi: 10.1016/s0896-6273(04)00015-7. [DOI] [PubMed] [Google Scholar]
- Manczak M., Anekonda T. S., Henson E., Park B. S., Quinn J., Reddy P. H. Hum. Mol. Genet. 2006;15:1437–1449. doi: 10.1093/hmg/ddl066. [DOI] [PubMed] [Google Scholar]
- Sokolove P. M. Int. J. Biochem. 1994;26:1341–1350. doi: 10.1016/0020-711x(94)90176-7. [DOI] [PubMed] [Google Scholar]
- Baines C. P. J. Mol. Cell Cardiol. 2009;46:850–857. doi: 10.1016/j.yjmcc.2009.02.007. [DOI] [PMC free article] [PubMed] [Google Scholar]
- Halestrap A. P. Biochem. Soc. Trans. 2010;38:841–860. doi: 10.1042/BST0380841. [DOI] [PubMed] [Google Scholar]
- He L., Lemasters J. J. FEBS Lett. 2002;512:1–7. doi: 10.1016/s0014-5793(01)03314-2. [DOI] [PubMed] [Google Scholar]
- Yarana C., Sripetchwandee J., Sanit J., Chattipakorn S., Chattipakorn N. Arch. Med. Res. 2012;42:333–338. doi: 10.1016/j.arcmed.2012.06.010. [DOI] [PubMed] [Google Scholar]
- Zorattia M., Szabò I., Marchia U. D. Biochim. Biophys. Acta, Bioenerg. 2005;1706:40–52. doi: 10.1016/j.bbabio.2004.10.006. [DOI] [PubMed] [Google Scholar]
- Baratli Y., Charles A. L., Wolff V., Tahar L. B., Smiri L., Bouitbir J., Zoll J., Piquard F., Tebourbi O., Sakly M., Abdelmelek H., Geny B. Toxicol. in Vitro. 2013;27:2142–2148. doi: 10.1016/j.tiv.2013.09.006. [DOI] [PubMed] [Google Scholar]
- Li N., Sioutas C., Cho A., Schmitz D., Misra C., Sempf J., Wang M. Y., Oberley T., Froines J., Nel A. Health Perspect. 2003;111:455–460. doi: 10.1289/ehp.6000. [DOI] [PMC free article] [PubMed] [Google Scholar]
- Zhang S. R., Fu J. L., Zhou Z. C. Toxicol. in Vitro. 2004;18:71–77. doi: 10.1016/j.tiv.2003.09.002. [DOI] [PubMed] [Google Scholar]
- Daum G. Biochim. Biophys. Acta. 1985;822:1–42. doi: 10.1016/0304-4157(85)90002-4. [DOI] [PubMed] [Google Scholar]
- Schneider A. K., Smith E. E., Hunter F. E. Biochemistry. 1964;3:1470–1477. doi: 10.1021/bi00898a014. [DOI] [PubMed] [Google Scholar]
- Lansdown A. B. G. Curr. Probl. Dermatol. 2006;33:17–34. doi: 10.1159/000093928. [DOI] [PubMed] [Google Scholar]
- Foldbjerg R., Dang D. A., Autrup H. Arch. Toxicol. 2011;85:743–750. doi: 10.1007/s00204-010-0545-5. [DOI] [PubMed] [Google Scholar]
- Morozov V. A., Ogawa M. Y. Inorg. Chem. 2013;52:9166–9168. doi: 10.1021/ic400760v. [DOI] [PubMed] [Google Scholar]
- Carlson C., Hussain S. M., Schrand A. M., Stolle L. K. B., Hess K. L., Jones R. L., Schlager J. J. J. Phys. Chem. B. 2008;112:13608–13619. doi: 10.1021/jp712087m. [DOI] [PubMed] [Google Scholar]
- Shang L., Dörlich R. M., Trouillet V., Bruns M., Nienhaus G. U. Nano Res. 2012;5:531–542. [Google Scholar]
- AshaRani P. V., Mun G. L. K., Hande M. P., Valiyaveettil S. ACS Nano. 2009;3:279–290. doi: 10.1021/nn800596w. [DOI] [PubMed] [Google Scholar]
- Shiang Y. C., Huang C. C., Chen W. Y., Chen P. C., Chang H. T. J. Mater. Chem. 2012;22:12972–12982. [Google Scholar]
- Lok C. N., Ho C. M., Chen R., He Q. Y., Yu W. Y., Sun H. Z., Tam P. K. H., Chiu J. F., Che C. M. J. Proteome Res. 2006;5:916–924. doi: 10.1021/pr0504079. [DOI] [PubMed] [Google Scholar]
- Rao Y., Lei Y. M., Cui X. Y., Liu Z. W., Chen F. Y. J. Alloys Compd. 2013;565:50–55. [Google Scholar]
- Yuan X., Luo Z. T., Zhang Q. B., Zhang X. H., Zheng Y. G., Lee J. Y., Xie J. P. ACS Nano. 2011;5:8800–8808. doi: 10.1021/nn202860s. [DOI] [PubMed] [Google Scholar]
- Li J. H., Zhang Y., Xiao Q., Tian F. F., Liu X. R., Li R., Zhao G. Y., Jiang F. L., Liu Y. J. Hazard. Mater. 2012;194:440–444. doi: 10.1016/j.jhazmat.2011.07.113. [DOI] [PubMed] [Google Scholar]
- Kamo N., Muratsugu M., Hongoh R., Kobatake Y. J. Membr. Biol. 1979;49:105–121. doi: 10.1007/BF01868720. [DOI] [PubMed] [Google Scholar]
- Fernandes M. A. S., Custódio J. B. A., Santos M. S., Moreno A. J. M., Vicente J. A. F. Mitochondrion. 2006;6:176–185. doi: 10.1016/j.mito.2006.06.002. [DOI] [PubMed] [Google Scholar]
- Li J. H., Liu X. R., Zhang Y., Tian F. F., Zhao G. Y., Yu Q. L. Y., Jiang F. L., Liu Y. Toxicol. Res. 2012;1:137–144. [Google Scholar]
- Liu X. R., Li J. H., Zhang Y., Ge Y. S., Tian F. F., Dai J., Jiang F. L., Liu Y. J. Membr. Biol. 2011;244:105–112. doi: 10.1007/s00232-011-9403-5. [DOI] [PubMed] [Google Scholar]
- Monteiro J. P., Oliveira P. J., Moreno A. J. M., Jurado A. S. Chemosphere. 2008;72:1347–1354. doi: 10.1016/j.chemosphere.2008.04.024. [DOI] [PubMed] [Google Scholar]
- Xia T., Jiang C., Li L., Wu C., Chen Q., Liu S. S. FEBS Lett. 2002;510:62–66. doi: 10.1016/s0014-5793(01)03228-8. [DOI] [PubMed] [Google Scholar]
- Gornall A. G., Bardawill C. J., David M. M. J. Biol. Chem. 1949;177:751–766. [PubMed] [Google Scholar]
- Petronilli V., Šileikytė J., Zulian A., Dabbeni-Sala F., Jori G., Gobbo S., Tognon G., Nikolov P., Bernardi P., Ricchelli F. Biochim. Biophys. Acta, Bioenerg. 2009;1787:897–904. doi: 10.1016/j.bbabio.2009.03.014. [DOI] [PubMed] [Google Scholar]
- Bernardi P., Vassanelli S., Veronese P., Colonna R., Szabò I., Zoratti M. J. Biol. Chem. 1992;267:2934–2939. [PubMed] [Google Scholar]
- Szewczy A., Wojtczak L. Pharmacol. Rev. 2002;54:101–127. doi: 10.1124/pr.54.1.101. [DOI] [PubMed] [Google Scholar]
- Vicente J. A. F., Santos M. S., Vercesi A. E., Madeira V. M. C. Pestic. Sci. 1998;54:43–51. [Google Scholar]
- Fernandes M. A. S., Jurado A. S., Videira R. A., Santos M. S., Moreno A. J. M., Velena A., Duburs G., Oliveira C. R., Vicente J. A. F. Mitochondrion. 2005;5:341–351. doi: 10.1016/j.mito.2005.06.004. [DOI] [PubMed] [Google Scholar]
- Baracca A., Sgarbi G., Solaini G., Lenaz G. Biochim. Biophys. Acta. 2003;1606:137–146. doi: 10.1016/s0005-2728(03)00110-5. [DOI] [PubMed] [Google Scholar]
- Dong P., Li J. H., Xu S. P., Wu X. J., Xiang X., Yang Q. Q., Jin J. C., Liu Y., Jiang F. L. J. Hazard. Mater. 2016;308:139–148. doi: 10.1016/j.jhazmat.2016.01.017. [DOI] [PubMed] [Google Scholar]
- Zhao J., Zhou Z. Q., Jin J. C., Yuan L., He H., Jiang F. L., Yang X. G., Dai J., Liu Y. Chemosphere. 2014;100:194–199. doi: 10.1016/j.chemosphere.2013.11.031. [DOI] [PubMed] [Google Scholar]
- Yang L. Y., Gao J. L., Gao T., Dong P., Ma L., Jiang F. L., Liu Y. J. Hazard. Mater. 2016;301:119–126. doi: 10.1016/j.jhazmat.2015.08.046. [DOI] [PubMed] [Google Scholar]
- Ricchelli F., Gobbo S., Moreno G., Salet C. Biochemistry. 1999;38:9295–9300. doi: 10.1021/bi9900828. [DOI] [PubMed] [Google Scholar]
- Mookerjee S. A., Divakaruni A. S., Jastroch M., Brand M. D. Mech. Ageing Dev. 2010;131:463–472. doi: 10.1016/j.mad.2010.03.010. [DOI] [PMC free article] [PubMed] [Google Scholar]
- Yarana C., Sripetchwandee J., Sanit J., Chattipakorn S., Chattipakorn N. Arch. Med. Res. 2012;42:333–338. doi: 10.1016/j.arcmed.2012.06.010. [DOI] [PubMed] [Google Scholar]
- Zoratti M., Szabò I. Biochim. Biophys. Acta. 1995;1241:139–176. doi: 10.1016/0304-4157(95)00003-a. [DOI] [PubMed] [Google Scholar]
- Wei L. Y., Lu J. R., Xu H. Z., Patel A., Chen Z. S., Chen G. F. Drug Discovery Today. 2015;20:595–601. doi: 10.1016/j.drudis.2014.11.014. [DOI] [PMC free article] [PubMed] [Google Scholar]
- Arai Y., Miyayama T., Hirano S. Toxicology. 2015;328:84–92. doi: 10.1016/j.tox.2014.12.014. [DOI] [PubMed] [Google Scholar]


