. 2017 Mar 17;6(3):353–360. doi: 10.1039/c6tx00450d

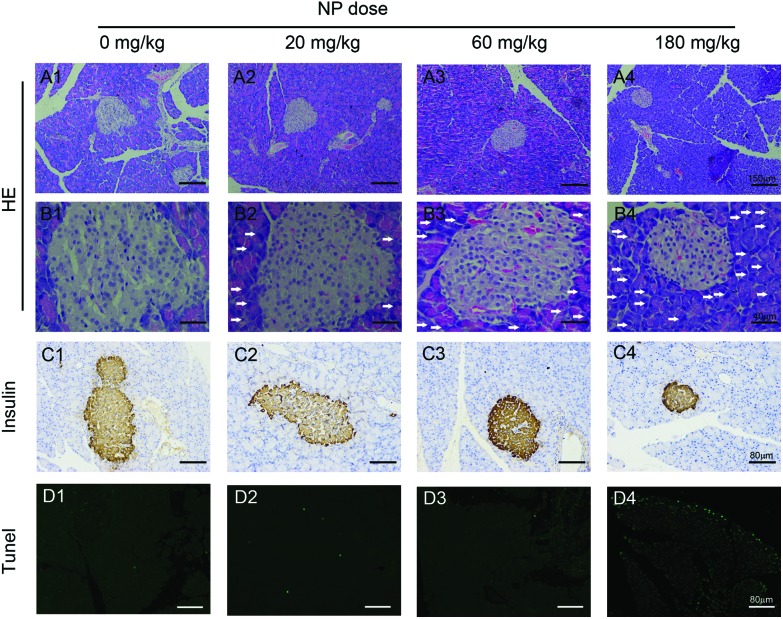
Fig. 2. Histopathology changes in the pancreas of rats treated with NP. Rats were treated with the indicated doses of NP for 90 consecutive days, after which their pancreases were harvested for histological analyses (n = 8 a representative image of the pancreas from each group is shown). A1–D1, 0 mg kg–1; A2–D2, 20 mg kg–1; A3–D3, 60 mg kg–1; A4–D4, 180 mg kg–1. A1–4, H&E staining of the pancreas with the indicated doses of NP treatment, 100×; B1–B4, H&E staining of the pancreas with the indicated doses of NP treatment, 400×; C1–4, the histopathology change of islets was analyzed by IHC staining with an insulin antibody, 200×; D1–4, cell death was analyzed using TUNEL staining, 200×. Scale bar for 100×: 150 μm; 200×: 80 μm; 400×: 40 μm. The white arrows indicated the infiltration of inflammatory cells in the pancreas of rats treated with NP.

Fig. 2