. 2016 Jan 11;5(2):583–593. doi: 10.1039/c5tx00305a

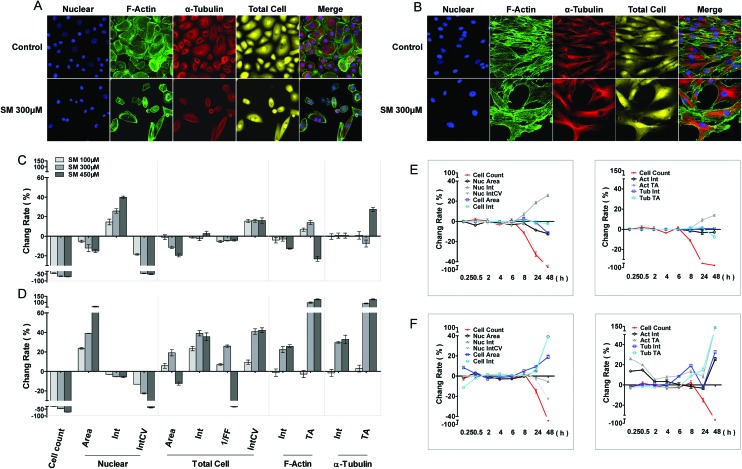
Fig. 1. Effects of SM on the morphology of HEK-f and HDF-a cells. A and B: representative images of nuclear, actin, tubulin, and whole-cell shape in HEK-f cells and HDF-a cells, respectively; C and D: change rate (%) of morphologic parameters induced by different concentrations of SM in HEK-f cells and HDF-a cells, respectively (the treated time of SM is 48 h); E and F: change rate (%) of morphologic parameters induced by 300 μM SM for different durations of time in HEK-f cells and HDF-a cells, respectively; Elong, elongation; 1/FF, 1/(form factor); Int, staining intensity; Int CV, coefficient of variation of staining intensity; TA, total area. The nucleus was stained with Hoechst33342. Actin was stained with Alexa Fluor 488–phalloidin. Tubulin was stained with a tubulin antibody and an Alexa Fluor 546-labeled secondary antibody. Whole-cell (cytoplasm) staining was stained with CellMask Deep Red. All results of cellular parameters derived from specific cellular fluorescence images, normalized and expressed as percentage changes of the control. The data were expressed as mean ± standard error. All experiments were performed in triplicate, with no less than 200 cells per well. A measured difference of 3 SDs (standard deviation) was considered a significant change.

Fig. 1