. 2016 Sep 6;5(6):1649–1662. doi: 10.1039/c6tx00211k

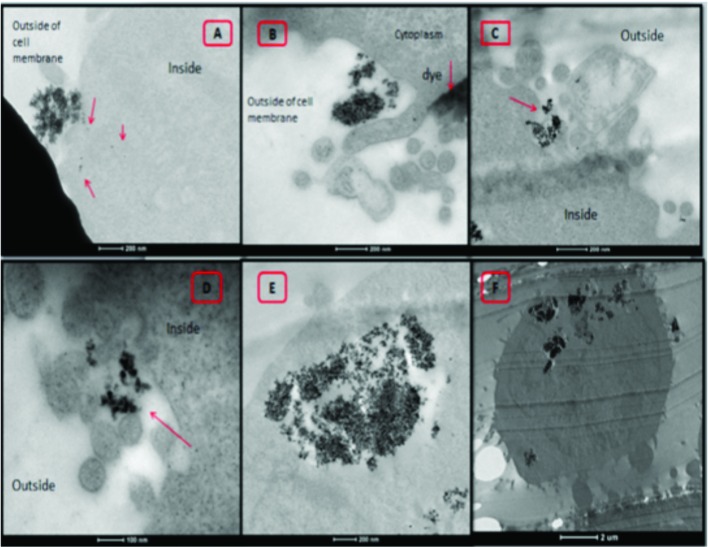
Fig. 5. Representative TEM microphotographs of MDA-MB-231 cells treated with CoFe-MNPs. The sections (A, C, D, E) were not stained with any reagent for detecting the cellular uptake of nanoparticles. Uptake of bare (A, B) and silica-coated (C, D) CoFe-MNPs was initiated upon the invagination of the plasma membrane (red arrows show MNPs). Some cells (B, C) still in the process of uptake at the plasma membrane. Some bare nanoparticles had already been internalized into the cells (E). Silica-coated MNPs were trapped inside the endosome (F). The scale bar is 200 nm for (A, B, C, E), 2 μm for (F) and 100 nm for (D). Images were collected using TEM and a digital camera.

Fig. 5