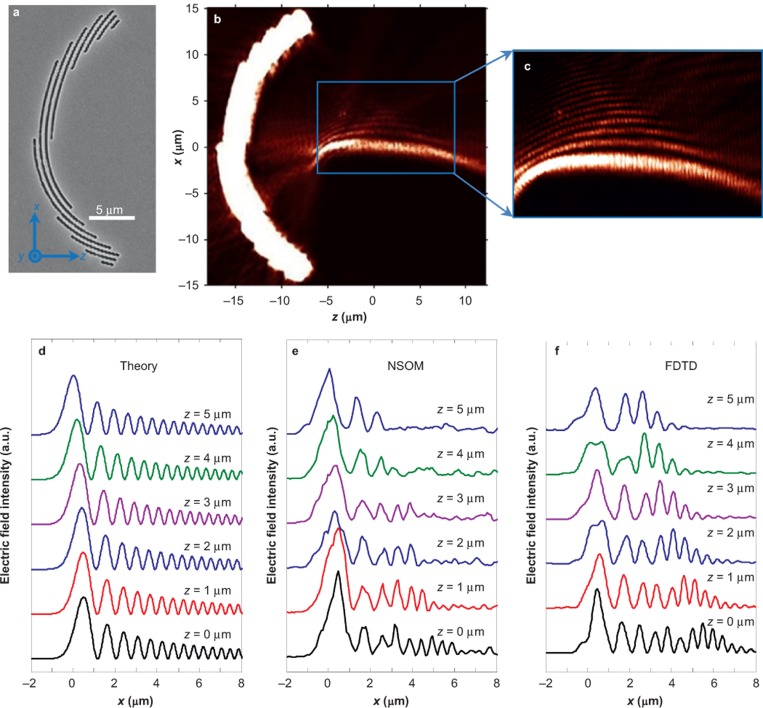
Figure 3.
(a) SEM micrograph of three-period nanostructures to synthesize the PAB, which is a special case of the PWB under paraxial approximation. x0=0.5 μm, r0=15 μm, and b=0.02. (b) NSOM measurement results of near-field electric field intensity distribution. (c) Zoom-in view of the blue box area in (b). For quantitative comparison and comprehensive evaluation of the beam properties, we give the line-to-line intensity distributions from 0 to 5 µm in a step of 1 µm obtained from the analytical formula, NSOM measurement, and FDTD calculation in (d), (e), and (f), respectively.

