Figure 3.


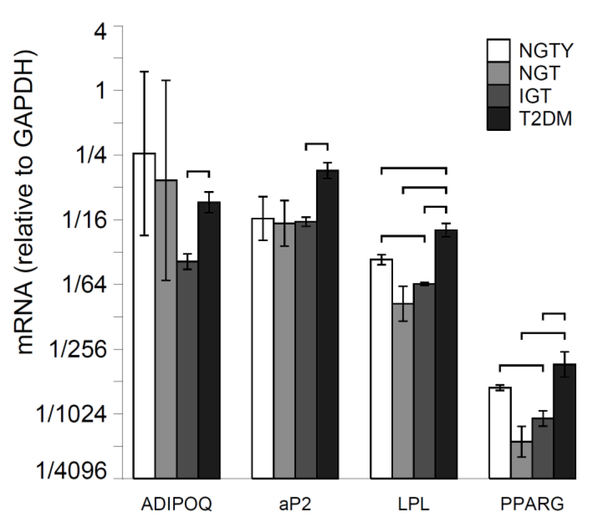
a: Expression of adipogenic gene markers
For each group, plot mRNA levels relative to the housekeeping gene (GAPDH). Error bars are +/− SEM about the mean delta Ct.
Horizontal brackets indicate p <= 0.05 for the comparison of mRNA values (relative to GAPDH) between the two groups pointed to by the ends of each bracket.
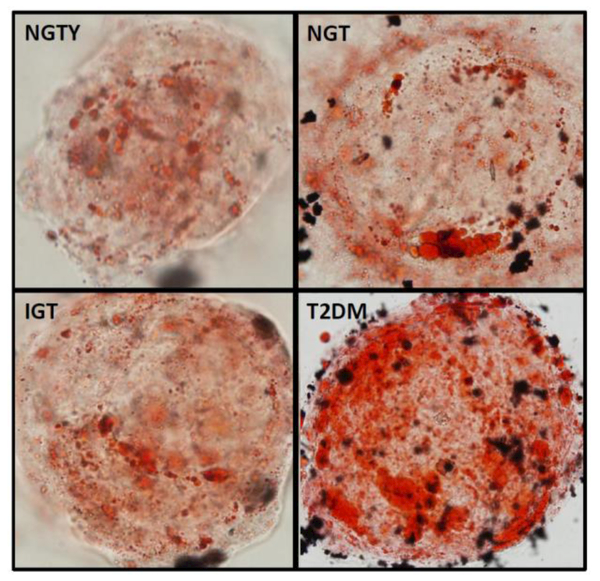
Young normal glucose tolerant (NGTY); post-menopausal normal glucose tolerant (NGT); post-menopausal impaired glucose tolerant (IGT); post-menopausal type 2 diabetes mellitus (T2DM); adiponectin (ADIPOQ); adipocyte protein 2 (aP2); lipoprotein lipase (LPL); peroxisome proliferator activated receptor gamma (PPARγ)
b: Oil Red O staining
Note: well plates photographed at 40× magnification
