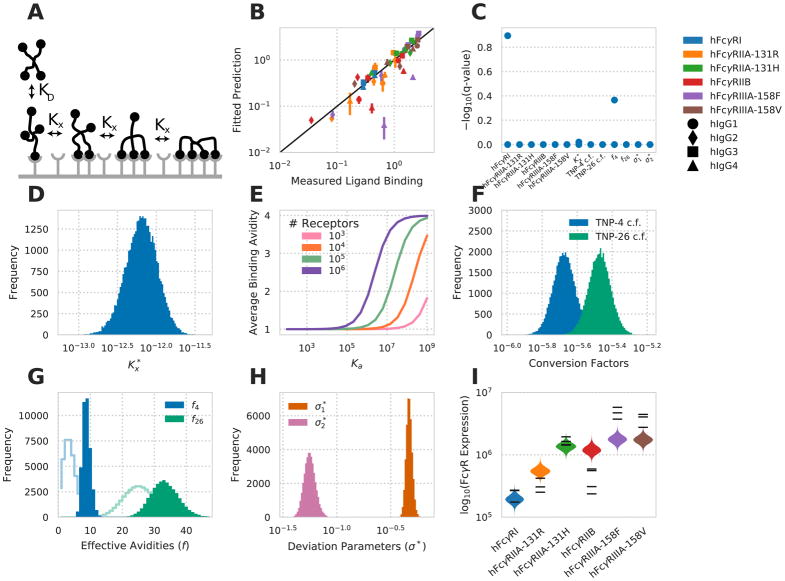
Figure 2. A multivalent binding model accounts for IgG-FcγR binding.
A) Schematic of the multivalent binding model for interaction of an IC with a single species of hFcγR. B) Predicted versus measured binding for each hFcγR-hIgG pair at each valency. C) Geweke convergence criterion for each walker of the MCMC chain. A significant p-value would indicate failed convergence. D) Marginal distribution for the crosslinking constant . E) Average binding valency predicted for a single interaction between a cell and an IC of valency four, versus monovalent binding affinity at varied receptor expression levels. F) Marginal distribution for the constants to convert IC binding to normalized MFI. G) Marginal distribution for the effective valencies of TNP-4-BSA and TNP-26-BSA. Prior shown as line. H) Marginal distribution for each distribution spread parameter. I) The marginal distributions for receptor expression within each cell line expressing a single hFcγR subtype. Experimental measurements of receptor expression (Fig. 1B) are individually overlaid. See also Figure S1.

