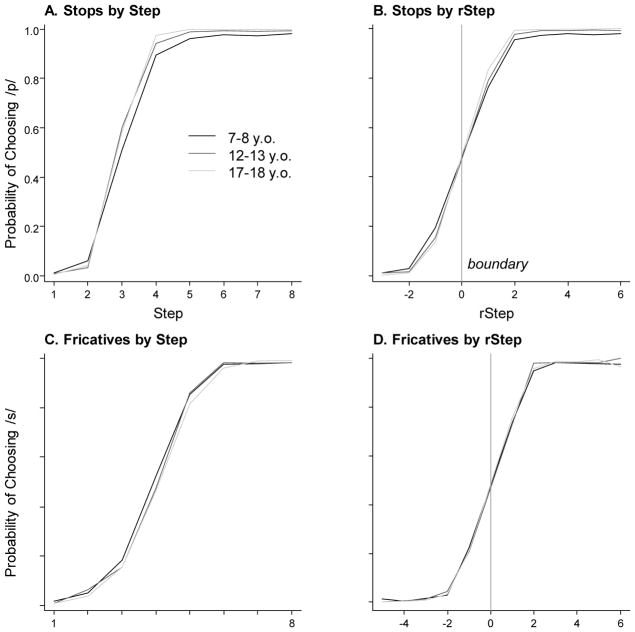
Figure 3.
Identification (mouse click) results. A) Proportion of /p/ responses as a function of step and age for the b/p stimuli; B) Identification of b/p continua as a function of relative step (rStep) which reflects distance from each participants’ own category boundary; C) Proportion of /s/ responses as a function of step and age for ʃ/s stimuli; D) ʃ/s identification as a function of rStep.

