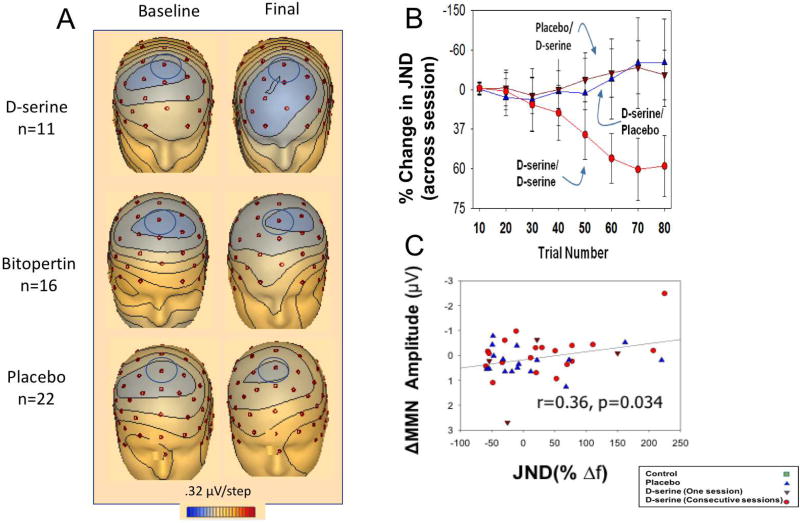
Figure 1.
A. Voltage topography maps for d-serine (top), bitopertin (middle) and placebo (bottom) subjects for MMN, shown at peak latencies. Analyzed electrode noted by blue circle (Fz). B. Line graph of % change in behavioral plasticity on the adaptive tone-matching task across sessions for the indicated treatment orders. C. Scatter plot for % change in behavioral plasticity on the adaptive tone-matching task vs. change in MMN amplitude to the trained tone. E. Modified from (8, 89). Error bars indicate standard error of the mean; ***p<0.001

