
Figure 4. Energy expenditure and RQ changes between pre and post-randomization in exenatide and placebo groups.
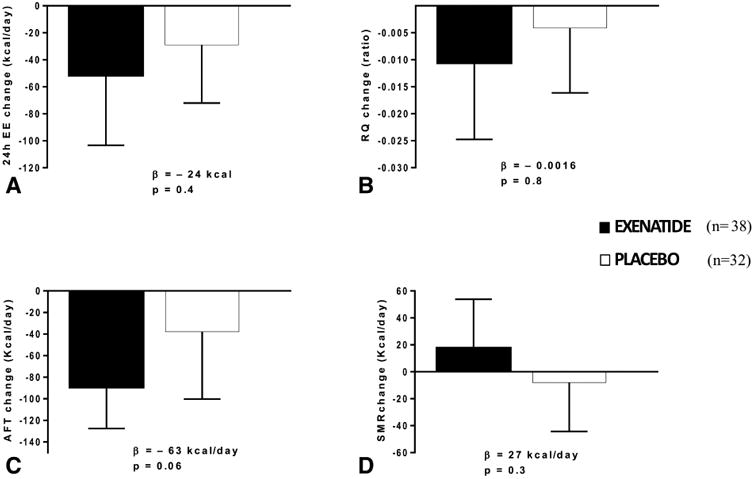
A Change in 24h-EE expressed as Kcal/day; B. Change in RQ; C. Change in AFT expressed as Kcal/day. D. Change in SMR expressed as Kcal/day.
The β indicate the absolute values of the difference between pre and post randomization measurements between the exenatide and placebo groups.
Error bars represent the mean with 95% confidence interval.
Thirty-eight participants in the exenatide group and 32 in the placebo group had complete EE data.