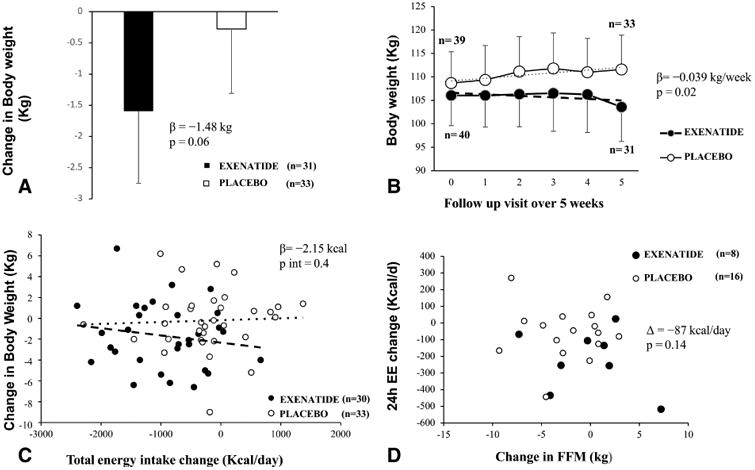
Figure 6.

A. Change in body weight (kg) from baseline over 5 weeks. The baseline weight was the weight at the time of the DXA scan. The β is the absolute difference (Kg), between the body weight at the 5-week follow up visit and the baseline weight. B. Weight trajectory in the exenatide versus placebo groups over 5 weeks. Data represents the mean body weight at the time of the DXA scan, at the day of discharge and at each weekly follow up visit. The two fitted regression lines represent the weekly rate of weight change in the 2 groups. The β value represents the difference in the rates of body weight change between the 2 groups. Analyses used mixed models for repeated measures of change from baseline adjusted for baseline weight (as baseline comparator). C. Correlation between body weight change and total energy intake from baseline over 5 weeks. Correlation between the pre and post-randomization change in ad libitum food intake, expressed as mean Kcal/day versus weight change at 5 weeks.
- In the panel A, the sample size (Exenatide=31, Placebo= 33) indicate the numbers of volunteers who have the weight measure at 5-week follow up visit. In the panel B, some values were not analyzed due to unavailability of some body weight measurements. In the panel C, the sample size (Exenatide =30, Placebo=33) shows participants having 5-week follow up weight and completed data of food intake. In the panel D, the sample size (Exenatide =8, Placebo=16) shows participants having 24-week follow up body composition measurements and completed data of chambers.
- Error bars represent the mean with 95% confidence interval.
