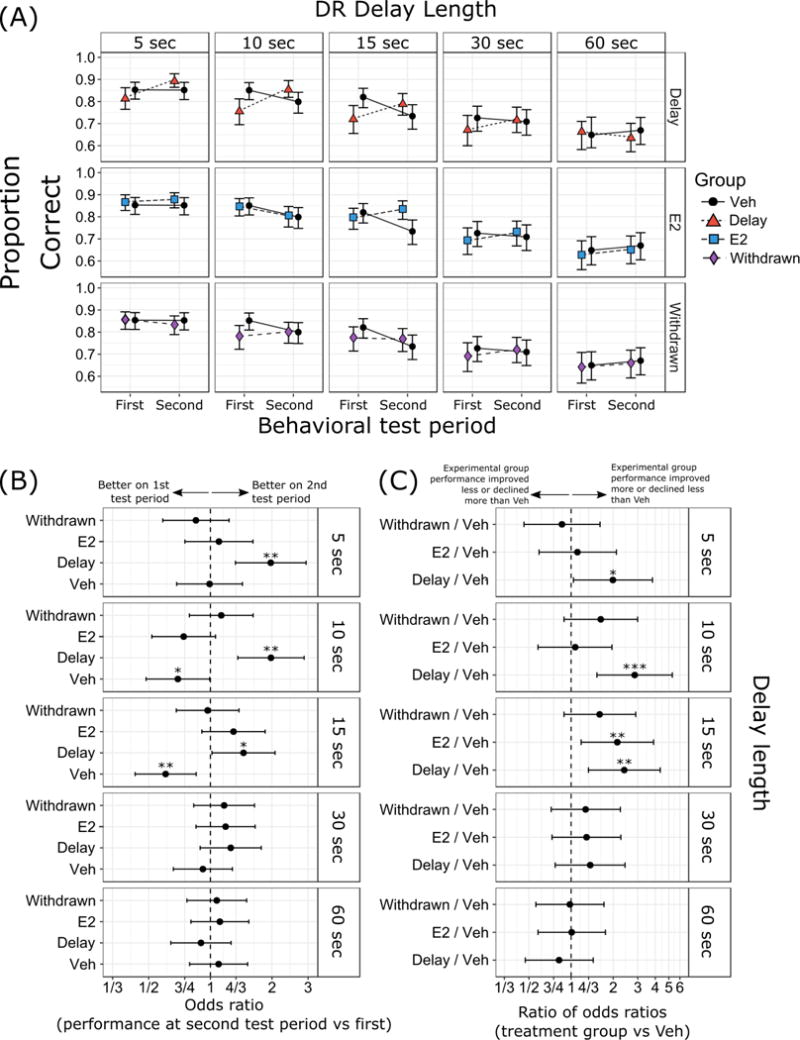
Figure 2. Delayed response (DR) task results.

(A) Proportion of correct responses with 95% confidence intervals. (B) Odds ratios (OR) between performance at second test period vs first test period, and (C) ratios of odds ratios (ROR) in performance across time in treatment groups relative to control. Results are separated by delay length (5 sec, 10 sec, 15 sec, 30 sec, and 60 sec delays). Group designations (Veh, E2, Delay, Withdrawn) as in Figure 1. *** p < 0.001, ** p < 0.01, * p < 0.05. p-values in (C) were corrected using Dunnett’s method for comparing parameters from three separate experimental groups (E2, Delay, and Withdrawn) to the control group (Veh).
