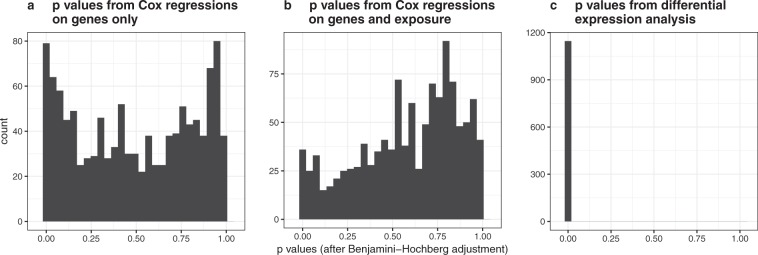
Figure 4.
Histograms of p values from differentially expressed genes in Cox regression analysis. The left and middle panels show the Benjamini-Hochberg adjusted p values of the influences of the genes in Cox regressions performed separately for each gene that used as covariates the corresponding genes (panel a) or the corresponding genes as well as the exposure RUNX1+ vs. RUNX1− (panel b). Panel c shows the Benjamini-Hochberg adjusted p values of the genes found to be differentially expressed at the 1% significance level from the differential expressions analysis performed using limma.

