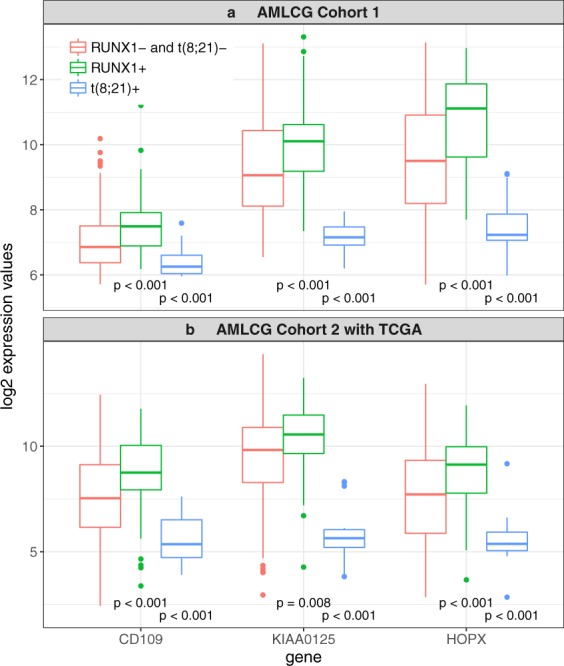
Figure 6.

Log2 expression values for the three genes selected as mediators both for the RUNX1+ vs. RUNX1− comparison and the t(8; 21)+ vs. t(8; 21)− comparison. Log2 expression values in AMLCG Cohort 1 (panel a) and AMLCG Cohort 2 with TCGA (panel b) for the three genes that appear in both, Supplementary Tables S1 and S2, separated by whether only mutations (RUNX1+), only fusion (t(8; 21)+) or neither of these two (RUNX1− and t(8; 21)−) are present in the respective patients. The p values are the results of Wilcoxon tests. For each gene, we tested ‘RUNX1+’ against ‘RUNX1− and t(8; 21)−’ and ‘t(8; 21)+’ against ‘RUNX1− and t(8; 21)−’.
