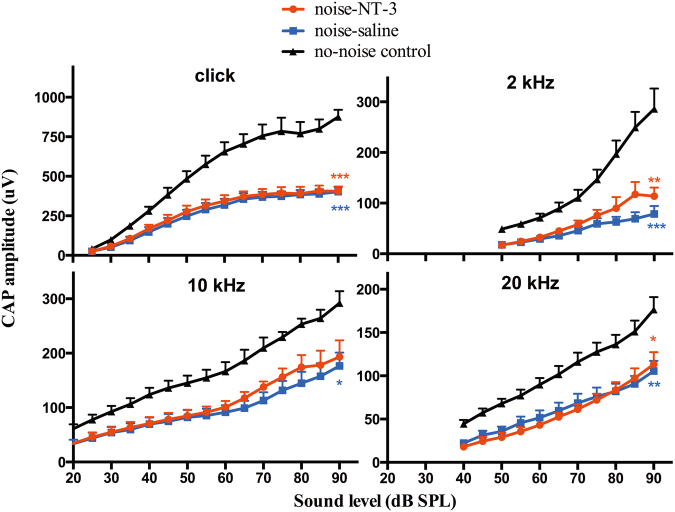
Fig. 3.
The CAP input/output function curves evoked clicks, and 2, 10, and 20 kHz tone bursts (n = 6 ears for each group). One-way ANOVA followed by Bonferroni’s post-hoc test was performed between groups at 90 dB SPL for each signal. Significant difference was seen between the no-noise control and those obtained from the ears exposed to the noise but not between the two ears exposed to the noise. Error bars represent ±1 SEM. The insert legends for individual curves applies to all panels. Asterisks indicates the significant level for the comparison between the two noise-exposed ears and the control. *p < 0.05, **p < 0.01, ***p < 0.001

