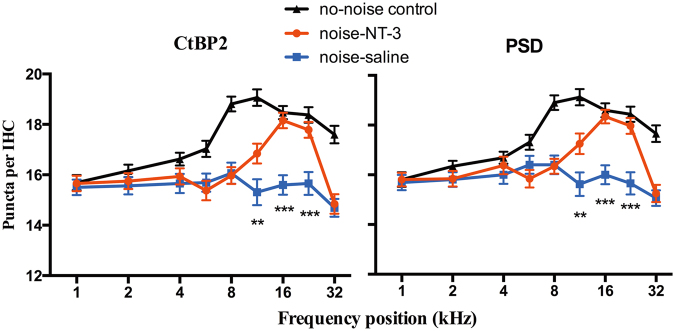
Fig. 6.
Comparison of synaptic density cochleograms across groups (n = 32 IHCs from seven cochleae of each group). The synaptic density was measured by counting the puncta of both CtBP2 (a) and PSD95 (b). The density cochleograms were made for the puncta/IHC as a function of frequency. The puncta were averaged over 32 IHCs obtained from 4 cochleae at each frequency point in each group. A two-way ANOVA followed by Bonferroni’s post-hoc test was performed to evaluate the density difference across groups at different frequencies. The synapse density of the noise-NT-3 group was found to be significantly higher than that of the noise-saline group at 11.3, 16, and 22.6 kHz (**p < 0.01, ***p < 0.001). Error bars represent ±1 SEM. The insert legend for the curves applies to all panels

