Fig. 3.
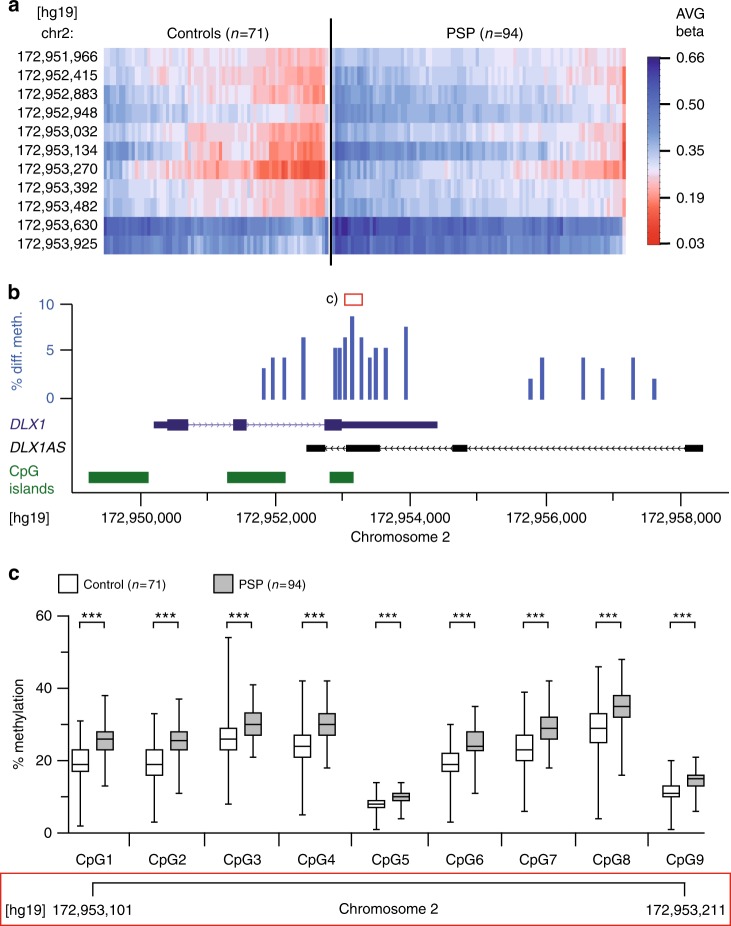
Methylation status of DLX1. a Heat-map showing degree of individual methylation at various genomic sites within DLX1 on chromosome 2 (chr2) in forebrains of n = 94 PSP patients vs. n = 71 controls. Average (AVG) beta indicates the color-coded methylation value (1.00 equals 100%, Genome Studio Software Version 2011.1, Illumina, San Diego, CA). b DLX1 is composed of three alternatively spliced exons (dark blue). DLX1 antisense transcript (DLX1AS) is encoded by at least four alternatively spliced exons (black). The location of CpG islands relative to DLX1 and DLX1AS is shown according to the UCSC genome browser data (green). The percentage difference in methylation in PSP as compared to controls at various sites within DLX1 and DLX1AS is shown as bar chart (blue). c Pyrosequencing confirmed the differential methylation at nine CpGs within the CpG island of the 3´UTR of DLX1 [red boxes in b and c indicate corresponding genomic regions; *** P < 0.001, Welch´s corrected unpaired t-test]. The line in the middle of the box and whisker graph represents the median (50th percentile). The box extends from the 25th to 75th percentile. The whiskers extend from the lowest to the highest value

