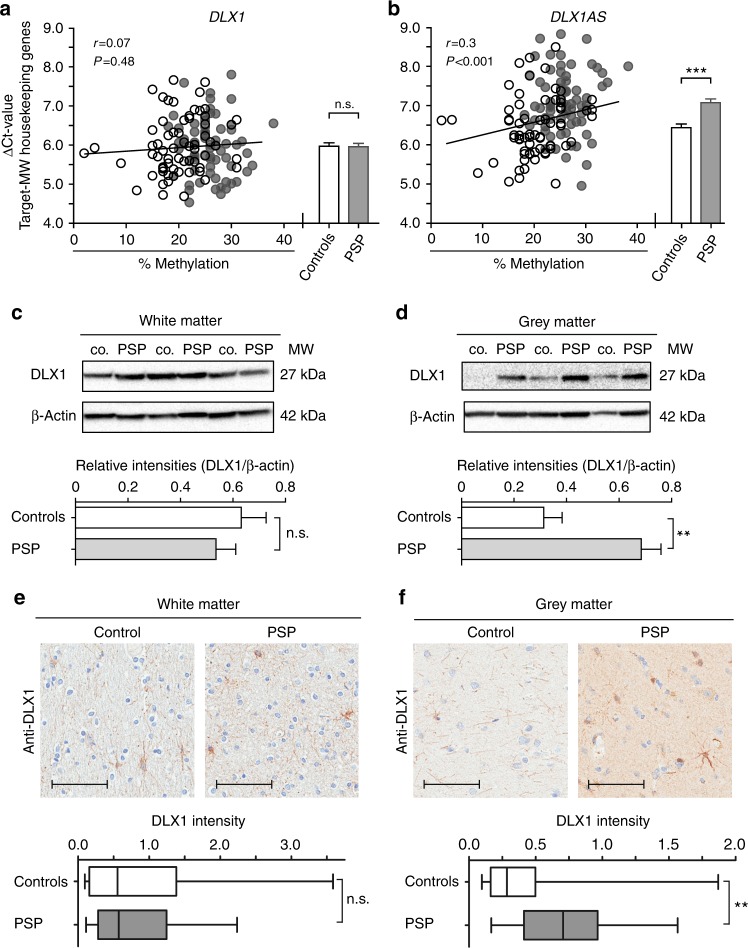
Fig. 4.
DLX1 expression. a No correlation between expression of DLX1 and degree of methylation in human forebrains (pyrosequencing value at CpG [hg19]chr2:172,953,097) [Pearson’s correlation analysis including both PSP patients (n = 69, gray dots) and controls (n = 67, white dots)]. Expression of DLX1 did not differ between patients and controls (Welch´s corrected unpaired t-test, n.s. = not significant, bar plot with mean and SEM). b Significant correlation between expression of DLX1AS and the degree of methylation. Expression of DLX1AS is significantly reduced in patients as compared to controls (***P < 0.001, Welch´s corrected unpaired t-test, bar plot with mean and SEM). c, d No difference between the amount of DLX1 protein in white matter of frontal lobe of PSP patients and controls (co.). c Significant increase of DLX1 protein in frontal lobe gray matter of PSP as compared to controls. d (n = 8 per group, **P < 0.01, Welch´s corrected unpaired t-test, bar plot with mean and SEM). β-Actin was used as loading control. e No difference in immunoreactivity of DLX1 in white matter of gyrus frontalis between PSP and controls. f Significant increase of DLX1 protein in frontal lobe gray matter of PSP patients as compared to controls (n = 24 PSP, n = 9 controls, **P < 0.01, Mann–Whitney Test). Scale bar: 100 µm. The line in the middle of the box and whisker graph represents the median (50th percentile). The box extends from the 25th to 75th percentile. The whiskers extend from the lowest to the highest value

