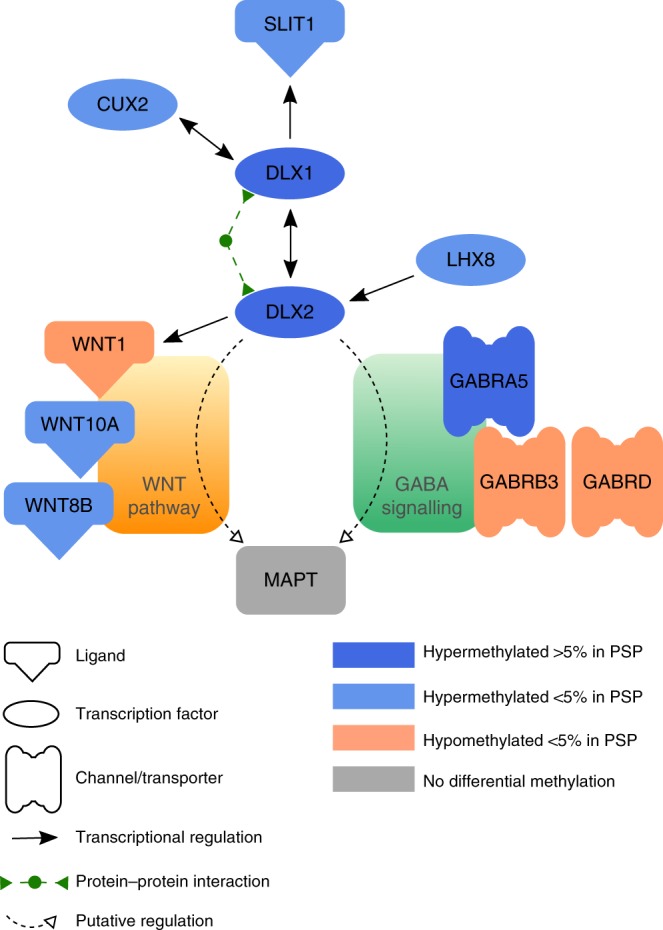
Fig. 6.

Pathway analysis. The pathway proposed was deduced from in silico literature mining for functional interactions of the differentially methylated genes. The network was consolidated by verification of each interaction in the published literature. Hypermethylated genes are depicted in blue and hypomethylated genes are given in orange. Note that DLX1/DLX2 may influence MAPT either via the WNT (brown) or via the GABA signaling (green) pathway (for details see text)
