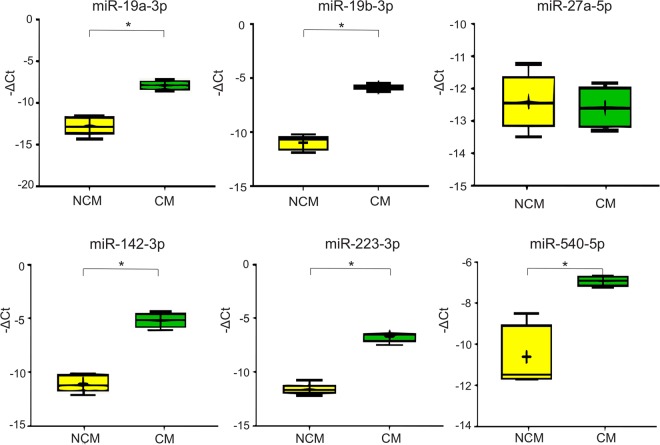
Figure 3.
Boxplots showing the qPCR validation results. The expression levels of miR-19a-3p, miR-19b-3p, miR-27a-5p, miR-142-3p, miR-223-3p and miR-540-5p, selected according the OpenArray results outcome, were measured by real-time RT-PCR. The horizontal line denotes the median value, the box encompasses the upper and lower quartiles, whiskers show the range, and the plus symbol denotes the mean. Mann-Whitney test results are denoted in the plot with horizontal bars and asterisks (*P < 0.05).

