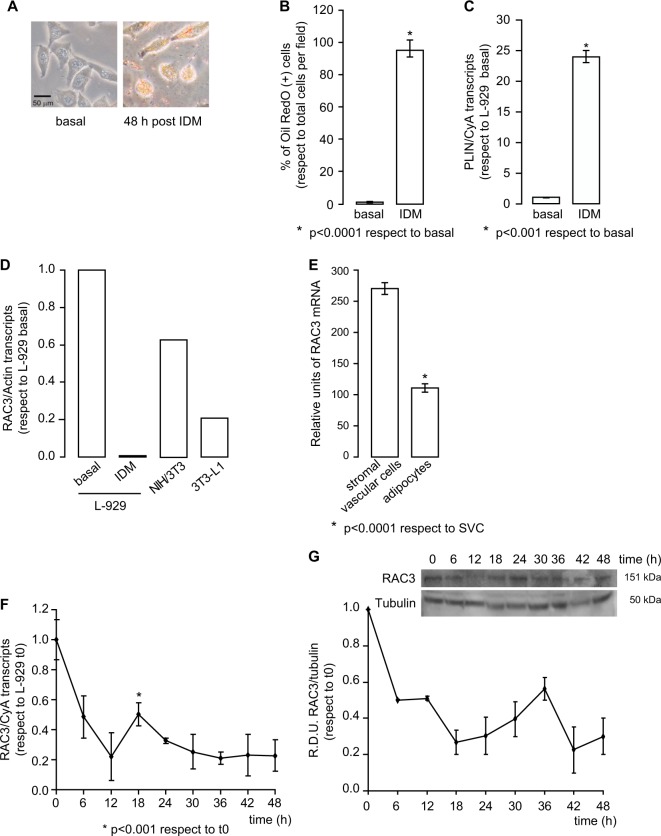
Fig. 1. IDM induces L-929 adipocyte differentiation.
a Representative images of the L-929 cell line stimulated or not with IDM for 48 h. Cells were stained with Oil Red O. b Diagram bars correspond to percentage of Oil Red O positive cells per field (at least 10 fields per sample). Student test was performed (n = 3), *p < 0.0001 with respect to basal condition. c Perilipin (PLIN) mRNA expression in basal condition or 48 h post induction with IDM was determined by qPCR and normalized with Cyclophilin A (CyA) mRNA. Student test was performed (n = 3), *p < 0.001 with respect to basal condition. d RAC3 expression levels were evaluated by qPCR in L-929 cells in basal conditions or 48 h post IDM treatment, NIH/3T3 and 3T3-L1 cells, and were normalized to Actin mRNA. e RAC3 expression levels of stromal vascular cells (SVC) and adipocytes from murine epididymal tissue were compared. The diagram bars show the average ± SD of mRNA expression log-transformed values from GSE65557 data bank *p < 0.0001 with respect to SVC. f, g Temporal RAC3 expression levels, after IDM treatment, were analysed by f qPCR or g western blot. f Each point corresponds to average ± SD of RAC3 mRNA expression obtained by qPCR and normalized to CyA mRNA, *p < 0.001 with respect to t0. g Western blot was performed to determine RAC3 protein levels, relative densitometry units (RDU) correspond to the densitometry unit with respect to Tubulin expression. Inset corresponds to representative immunoblot

