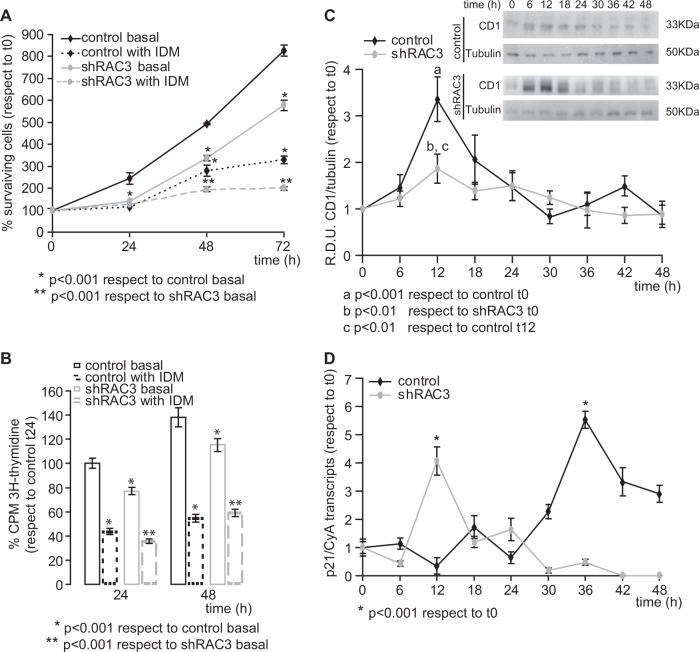
Fig. 4. RAC3 downregulation is required for induction of cell arrest.
a, b Cell viability was determined by a crystal violet staining or b tritiated thymidine uptake assays in control and shRAC3 L-929 cells treated or not with IDM at different times. Curves and diagram bars represent the average ± SD percentage of surviving cells with respect to 0 h (n = 3), * and **p < 0.001 with respect to control and shRAC3 L-929 cells in basal conditions, respectively. c, d Temporal modulation of Cyclin D1 (CD1) (c) and p21 (d) expression levels in control and shRAC3 L-929 cells after adipocyte differentiation induction. c CD1 protein levels were evaluated by western blot at different time points after IDM stimulation, curves represent RDU corresponding to the average of densitometry units with respect to Tubulin expression, (n = 3) a p < 0.001 with respect to control L-929 cells in basal conditions, b p < 0.01 with respect to shRAC3 L-929 cells in basal conditions and c p < 0.01 with respect to control L-929 cells at 12 h post induction. Inset corresponds to representative immunoblot. d p21 mRNA was evaluated by qPCR and normalized to CyA mRNA expression. Curves represent the average ± SD of three independent experiments, *p < 0.001 with respect to basal condition

