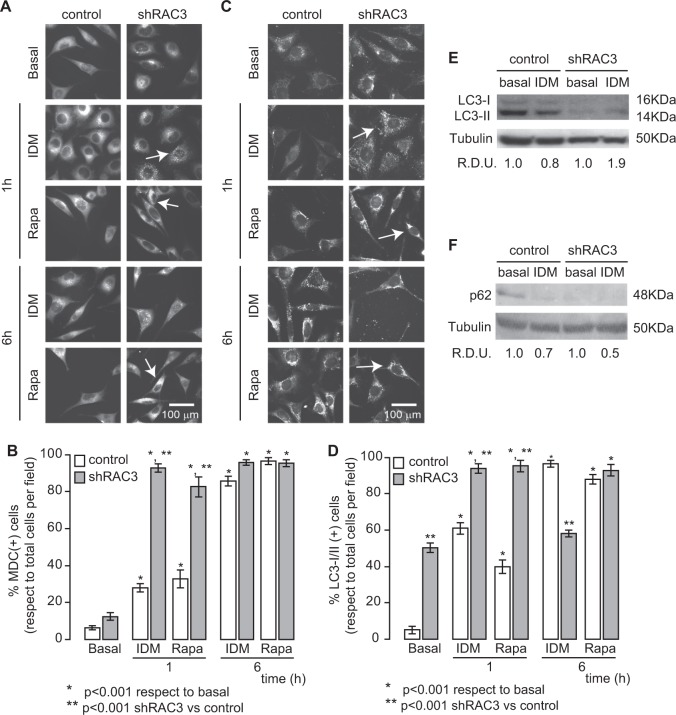
Fig. 5. IDM induces autophagy.
a–d Control and shRAC3 L-929 cells were seeded in 24-well plates with slices and, after 24 h, cells were stimulated with IDM or Rapamycin (Rapa 0.5 μM). a, b Autophagy was evaluated by staining with monodansylcadaverine (MDC) or c, d immunofluorescence using an anti-LC3-I/II antibody and an anti-rabbit coupled to FITC antibody after 1 or 6 h post treatment. The arrows show MDC or LC3-I/II positive vesicles, respectively. b, d Diagram bars correspond to percentage of MDC or LC3-I/II positive cells per field (at least 10 fields per sample). Statistical analysis ANOVA and Tukey post-test n = 3 were performed, *p < 0.001 with respect to basal condition, **p < 0.001 with respect to control L-929 cells. e, f LC3-I/II (e) and p62 (f) levels were determined by western blot after 90 min post IDM treatment. RDU correspond to the average of densitometry unit with respect to Tubulin expression

