Figure 4.

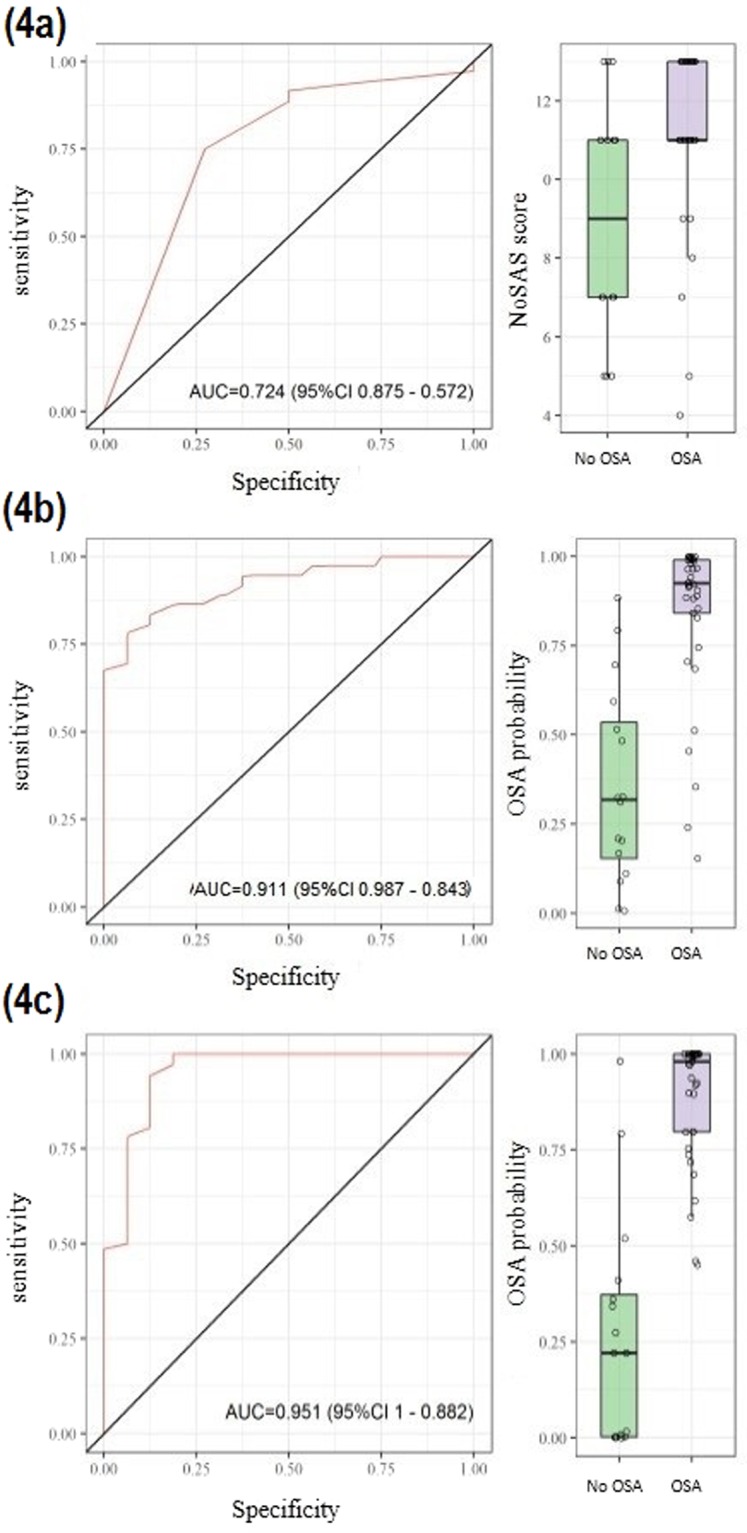
Receiver operating characteristic curve (ROC curve) with, respectively, AUC for (a) NoSAS score parameters, (b) metabolites statistically significant to screening OSA group and (c) lipids statistically significant to screening of OSA.

Receiver operating characteristic curve (ROC curve) with, respectively, AUC for (a) NoSAS score parameters, (b) metabolites statistically significant to screening OSA group and (c) lipids statistically significant to screening of OSA.