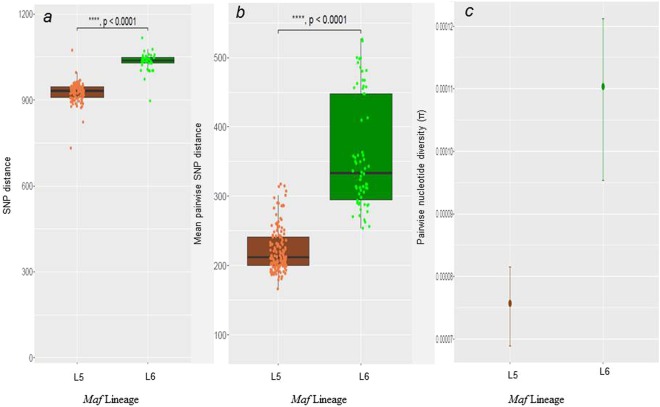
Figure 1.
Whole genome diversity of Maf Lineages (175 L5 and 78 L6 genomes). (a) Number of SNPs between Maf genomes and the hypothetical MTBC ancestor (the median fixed SNPs of L5 (934) is lower (W = 417, p-value < 2.2e-16) compared to L6 (1,039). (b) Pairwise SNPs between genomes within each lineage (the median of the pairwise SNPs is lower (W = 234, p-value < 2.2e-16) in L5 (212) compared to L6 (334). (c) Whole genome average nucleotide diversity (π) between L5 and L6 (the mean diversity of L5 (0.000076) is significantly (non-overlapping 95% confidence intervals) lower than L6 (0.000110). Error bars indicate 95% confidence intervals.

