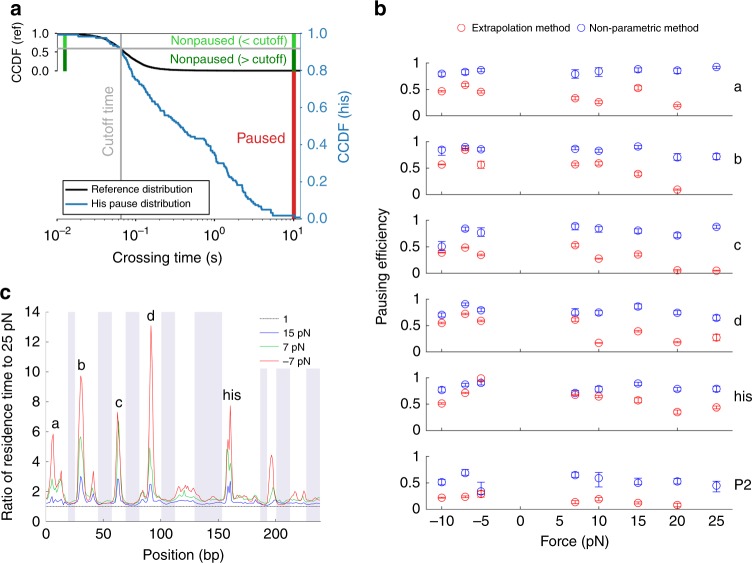
Fig. 2.
Pausing efficiencies are high and force-independent. a Description of the method used to calculate pausing efficiencies, illustrated for the ‘his’ pause at 10 pN assisting force. The reference distribution is rescaled to indicate the overlap between the two distributions below the cutoff time. For the distribution at the ‘his’ site, all events shorter than the cutoff are classified as non-paused (light green), as well as events longer than the cutoff in the same proportion as in the reference distribution (dark green). The remaining events (red) are classified as paused. b Pausing efficiencies at the major pause sites at different forces, calculated using extrapolation of the crossing time distributions above 1 s towards faster times (red), and by our nonparametric method (blue). Error bars indicate 25–75 percentiles for for 100 bootstrapped sets. c Residence time histogram ratios. The ratios of the residence times at three forces to the residence times at 25 pN assisting force are plotted. The ratio for 25 pN assisting force, which equals 1 by definition, is plotted as a reference

