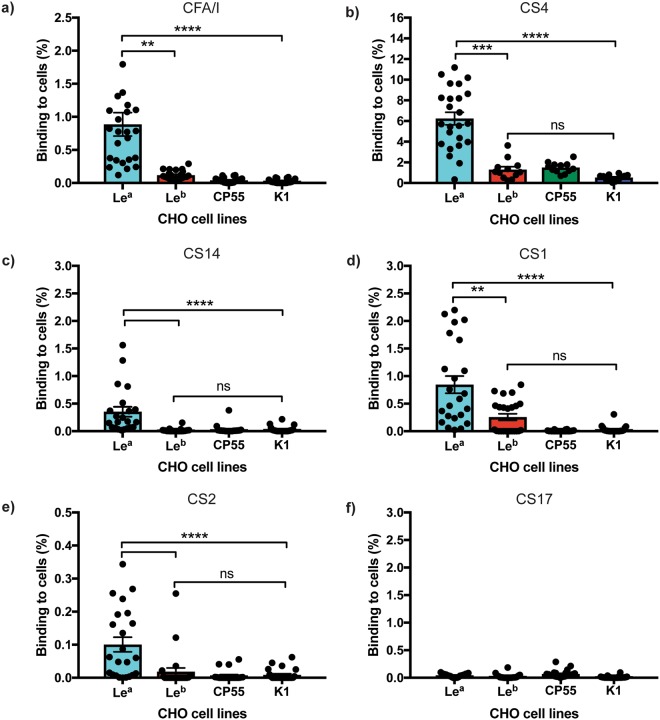
Figure 4.
ETEC CFA/I and other type 5 pili family members bind to CHO-Lea cells. (a) ETEC expressing CFA/I+ ST+/LT+ (b) ETEC expressing CS4+, ST−/LT− (c) ETEC expressing CS14+, STh+/LT− (d) ETEC expressing CS1+, ST−/LT− (e) ETEC expressing CS2+, ST−/LT−, and (f) ETEC expressing CS17+, ST−/LT+ and their binding to CHO-Lea, CHO-Leb, CHO-CP55 and CHO-K1 cells. Graphs represent the percentage of bacteria binding to each of the cell lines, as measured by quantifiable immunofluorescence analysis. Statistical analysis was performed using ANOVA with Dunn’s multiple comparisons test. **Indicates P = <0.0040, ***Indicates P = 0.0002, ****Indicates P = <0.0001. Data represent the Mean and SEM of two independent experiments.

