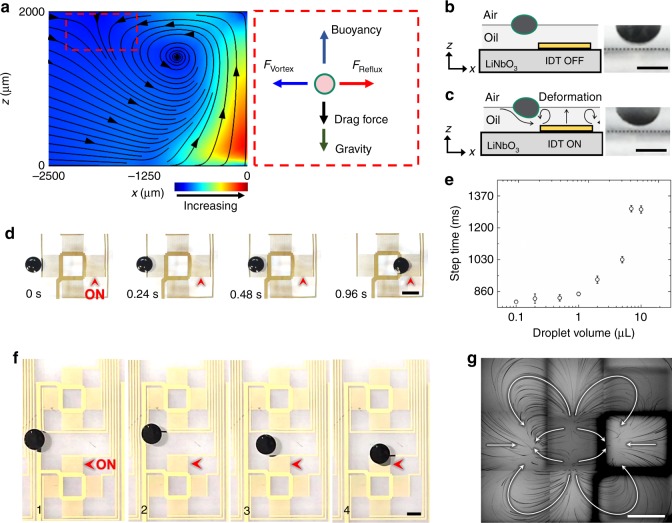
Fig. 3.
Characterization of the hydrodynamic trap. a Calculated streamlines from a numerical model of the forces generated by acoustic waves in the x–z-plane, and an illustration of the force balance along the x–z-plane at the trap. The counter-rotating vortices are clearly seen. Reflux and counter-rotating vortices cancel each other out and stabilized the droplet in the ±x directions. The drag force represents the sum of z-components of drag forces from counter-rotating vortex and reflux. b Side view of the immersed part of a 5 µL droplet when the IDT is turned off. The gray dashed line indicates the plane of the LiNbO3 substrate. c Side view of the immersed part of a 5 µL droplet when the IDT is turned on. The droplet slightly deforms upon the activation of acoustic streaming but remains floating on the oil layer, and above the substrate. d A sequence of time-elapsed, top-view images of the droplet-trapping process. The red arrow indicates the activated IDT. Two symmetrical hydrodynamic traps are created on opposite sides of the transducer, and the nearby droplet is transported by following the hydrodynamic gradient. Note that at 960 ms, the trapped droplet is mildly pinched and deformed by the counter-rotating vortices near the two transducer apertures. The 5 µL droplet’s shape conforms with the streamline distribution in Fig. 2f. e The relationship between the droplet volume and the step time. ‘Step time’ represents the time needed for translating 6.5 mm and stopping a droplet, the distance of a single step. f A free-floating droplet is restabilized near an excited IDT. The droplet naturally follows the local pressure gradient towards the IDT and then is stabilized at one of its hydrodynamic traps. g Particle tracking result showing the streaming pattern on the oil’s surface (top view). All streamlines of the reflux and the counter-rotating vortices converged at the two hydrodynamic traps. For a more detailed description of this image, please see Supplementary Fig. 3. All scale bars: 2 mm

