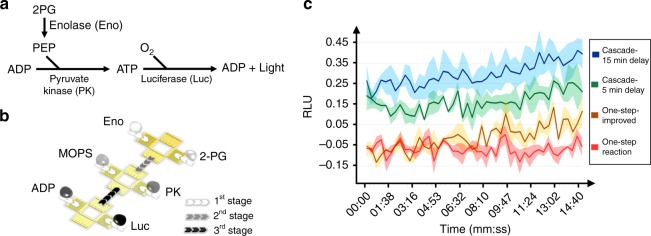
Fig. 7.
Enzyme cascade reaction for detecting enolase on a digital acoustofluidic device. a The mechanism of enolase detection. b Illustration of the six-droplet-merging sequence of the cascade reaction for enolase detection. c A comparison of the results for detecting 50 ng mL−1 of enolase with respect to elapsed time, performed using the one-step reaction on a plate and the cascade reaction using digital acoustofluidics. The relative luminescence units (RLU) are normalized to the negative control (no enolase) case. For the classic one-step reaction (red curve), the entire reaction mixture is applied to enolase sample immediately. In the improved one-step reaction configuration (yellow curve, labeled ‘One-step-improved’), the reaction mix is incubated for 5 min to wait for the background from 2-PG, ADP, Luc to fade before adding the enolase sample. For the cascade reactions, the enolase sample is firstly incubated with 2-PG for 5 min (green curve, labeled ‘Cascade-5 min delay’) or 15 min (blue curve, labeled ‘Cascade-15 min delay’) to produce an extra amount of PEP, which will then trigger a more intense signal increase with the other enzymes and substrates

