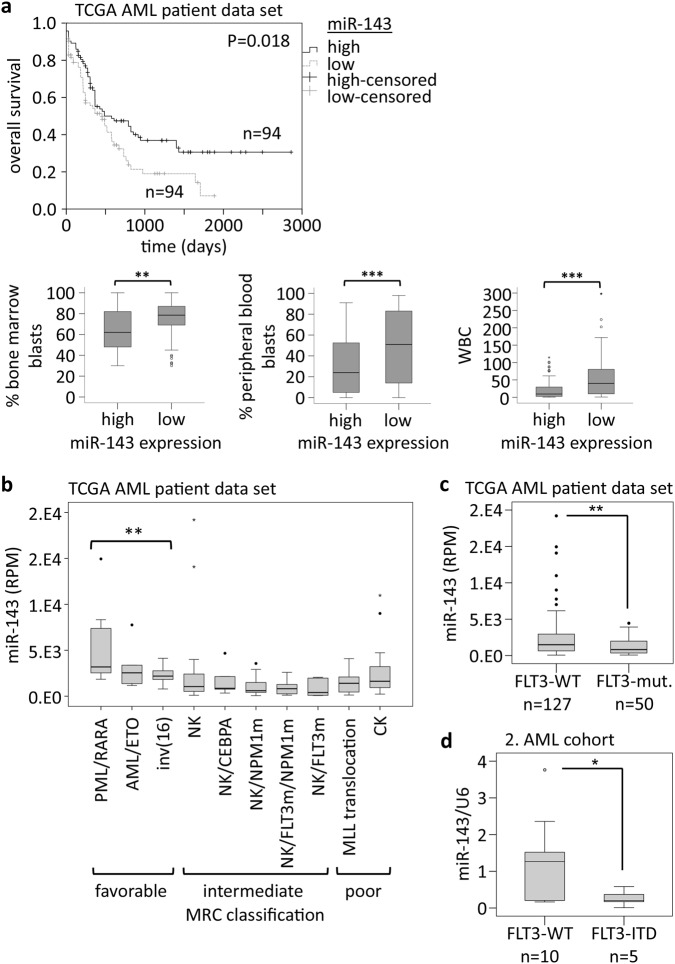
Fig. 4. miR-143 is a good prognostic factor in AML.
a Overall survival of AML patients (TCGA Research Network), according to the dichotomized miR-143 expression; (n = 188; Mann–Whitney-U test); (upper panel). Bone marrow blast count (BM blasts; left), peripheral blood blast count (PB blasts; middle), and number of white blood cells (WBC, right) in AML patients (TCGA Research Network), according to the dichotomized miR-143 expression (lower panel). Bars represent the median ± SD [high miR-143, n = 94; low miR-143, n = 94]. **P < 0.01; ***P < 0.001, unpaired two-tailed t-tests. b miR-143 expression in different AML subgroups classified according to the MRC (the British Medical Research Council); (TCGA). c miR-143 expression in AML patients with and without FLT3-mutations; (TCGA). Bars represent the median ± SD [FLT3-WT, n = 127; FLT3-mut. n = 50], P values are relative to FLT3-WT. **P < 0.01, unpaired two-tailed t-tests. d miR-143 expression in AML patients with wildtype FLT3 or a FLT3-ITD mutation (2. AML cohort). Bars represent the median ± SD [FLT3-WT, n = 10; FLT3-ITD, n = 5], P values are relative to FLT3-WT. *P < 0.05, unpaired two-tailed t-tests

