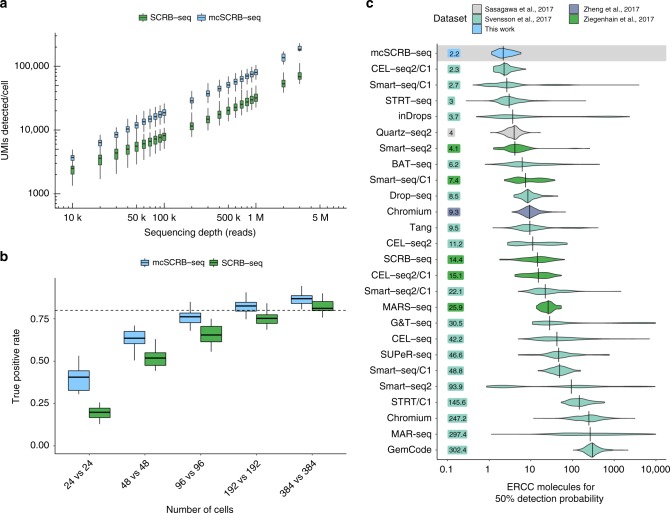
Fig. 2.
Comparison of mcSCRB-seq to SCRB-seq and other protocols. a Number of UMIs detected in libraries generated from 249 single mESCs using SCRB-seq or mcSCRB-seq when downsampled to different numbers of raw sequence reads. Each box represents the median and first and third quartiles per cell, sequencing depth and method. Whiskers indicate the most extreme data point that is no more than 1.5 times the length of the box away from the box. b The true positive rate of mcSCRB-seq and SCRB-seq estimated by power simulations using the powsimR package22. The empirical mean–variance distribution of the 10,904 genes that were detected in at least 10 cells in either mcSCRB-seq or SCRB-seq (500,000 reads) was used to simulate read counts when 10% of the genes are differentially expressed. Boxplots represent the median and first and third quartiles of 25 simulations with whiskers indicating the most extreme data point hat is no more than 1.5 times the length of the box away from the box. The dashed line indicates a true positive rate of 0.8. The matching plot for the false discovery rate is shown in Supplementary Fig. 11d. c Sensitivity of mcSCRB-seq and other protocols, calculated as the number of ERCC molecules needed to reach a 50% detection probability as calculated in Svensson et al5. Per-cell distributions are shown using violin plots with vertical lines and numbers indicating the median per protocol

