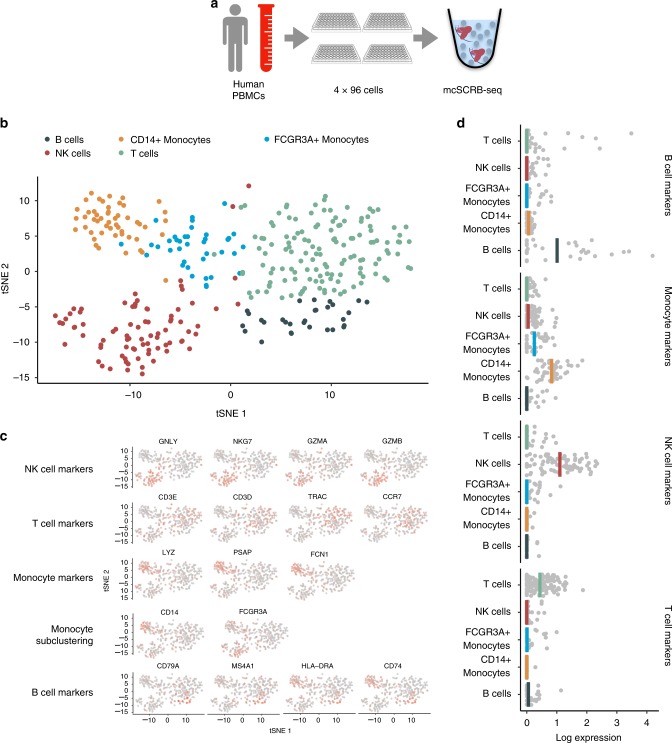
Fig. 3.
mcSCRB-seq distinguishes cell types of peripheral blood mononuclear cells. a PBMCs were obtained from a healthy male donor and FACS sorted into four 96-well plates. Using the mcSCRB-seq protocol, sequencing libraries were generated. b tSNE projection of PBMC cells (n = 349) that were grouped into five clusters using the Seurat package24. Colors denote cluster identity. c tSNE projection of PBMC cells (n = 349) where each cell is colored according to its expression level of various marker genes for the indicated cell types. Expression levels were log-normalized using the Seurat package. d Marker gene expression from c was summarized as the mean log-normalized expression level per cell. B-cell markers: CD79A, CD74, MS4A1, HLA-DRA; Monocyte markers: LYZ, PSAP, FCN1, CD14, FCGR3A; NK-cell markers: GNLY, NKG7, GZMA, GZMB; T-cell markers: CD3E, CD3D, TRAC, CCR7

