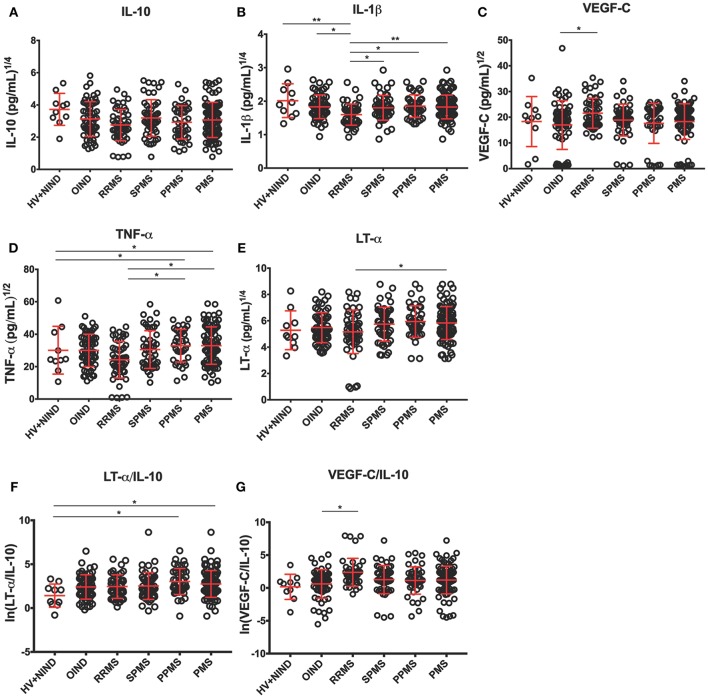
Figure 4.
Differences in CSF BCL cytokine secretion among diagnostic categories in the independent validation cohort. (A–E) Depict concentrations of cytokines normalized to 1 million of live seeded B cells, while (F,G) depict ratios of pro-inflammatory cytokines to immunoregulatory IL-10 that reached statistical significance after adjustment for multiple comparisons. Superscripts in the y-axis correspond to lambda values of Box-Cox statistical normalization test (A–E), while ln signifies natural logarithm of cytokine concentration values (F,G). Dots represent individual BCL concentration (or ratio of cytokine concentration). Red lines indicate mean with positive and negative standard deviation for each diagnostic group. Group differences were assessed using an ANOVA on a linear mixed model with subject specified as a random effect. *p < 0.05, **p < 0.01 (after adjustments for multiple comparisons).

