Figure 4.
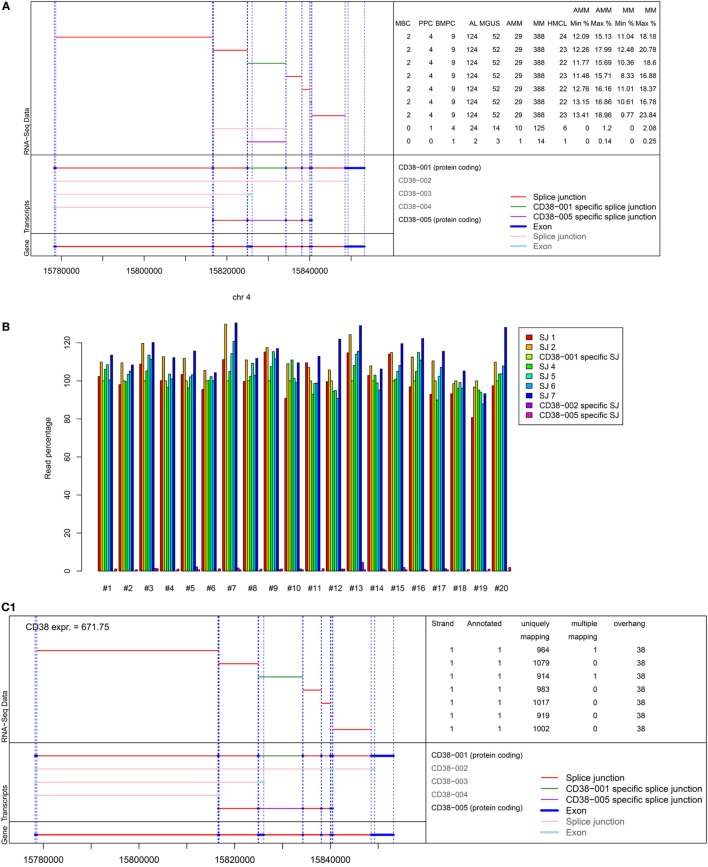
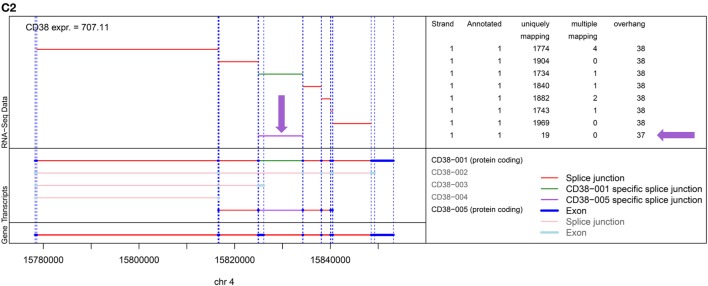
Analysis of alternative splicing of CD38. Five splice variants for CD38 are annotated in GRCh38, two of which being protein encoding, i.e., CD38-001 and CD38-005, focused on here. Of the three remaining transcripts, CD38-003 and CD38-004 are both non-protein coding due to retained intron sequences, and CD38-002 shows nonsense-mediated decay. (A) Shown is the structure of the CD38 locus (bottom left) followed by the different transcripts (n = 5) with splice junctions (n = 9) depicted in red and exons (n = 17) depicted in dark blue. Eight exons and seven splice junctions belong to CD38-001 and one junction exists only in CD38-001, depicted in green. The splice junction specific for CD38-005 is depicted in lilac. This is likewise explained in the bottom right part of the figure. The left part of the top panel shows the individual splice junctions expressed in RNA-seq analysis. The right part of the top panel gives the number of samples expressing the respective splice junction. The splice junction specific for CD38-001 is expressed in all 593 plasma cell samples while the one for CD38-005 is expressed only in 2/124 AL-patients (1.6%), 3/52 MGUS (5.8%), 1/29 AMM (3.4%), and 14/388 MM patient samples (3.6%), respectively. The last four columns give the minimum (min) and maximum (max) percentage of raw reads for the specific junctions compared to all reads spanning a CD38 splice junction in asymptomatic and symptomatic myeloma patients. (B) Given is the relative abundance of reads per splice junction in comparison to CD38-001 specific splice junction for the 20 patients in whom CD38-005 (lilac) supported by at least 10 reads was found. The maximum observed frequency is 1.8%. (C) Exemplary data for (C1) a patient showing expression of CD38-001 only. All seven splice junctions and eight exons are present. Reads for individual splice junctions are depicted to the right. (C2) Exemplary patient showing additional alternative splicing in terms of expression of CD38-005 but with low frequency (lilac arrows). In the depicted patient, the relative abundance of this specific junction compared to that of CD38-001 is 1.1%. See also Table S3 in Supplementary Material. RSEM transcript analysis for the same patients confirming the data is shown in Figure S7 in Supplementary Material.


