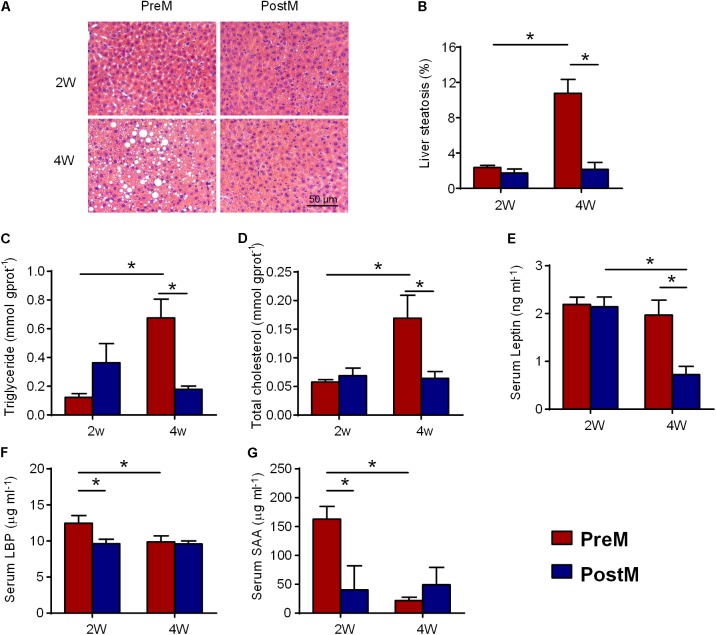
FIGURE 1.
PreM group showed increased lipid concentration and fat accumulation in liver after transplantation for 4 weeks; (A) Representative photomicrographs of hematoxylin- and eosin-stained sections of the liver (100× magnification); (B) bar graph of the volume density of liver steatosis; (C) hepatic triglyceride; (D) hepatic total cholesterol; (E) serum leptin; (F) serum LBP; and (G) serum SAA levels. Data are shown as the mean ± SEM and were compared between groups and time points using the Mann–Whitney U test; ∗P < 0.05. n = 4 or 5 for each group. LBP, lipopolysaccharide binding protein; SAA, serum amyloid A protein.

