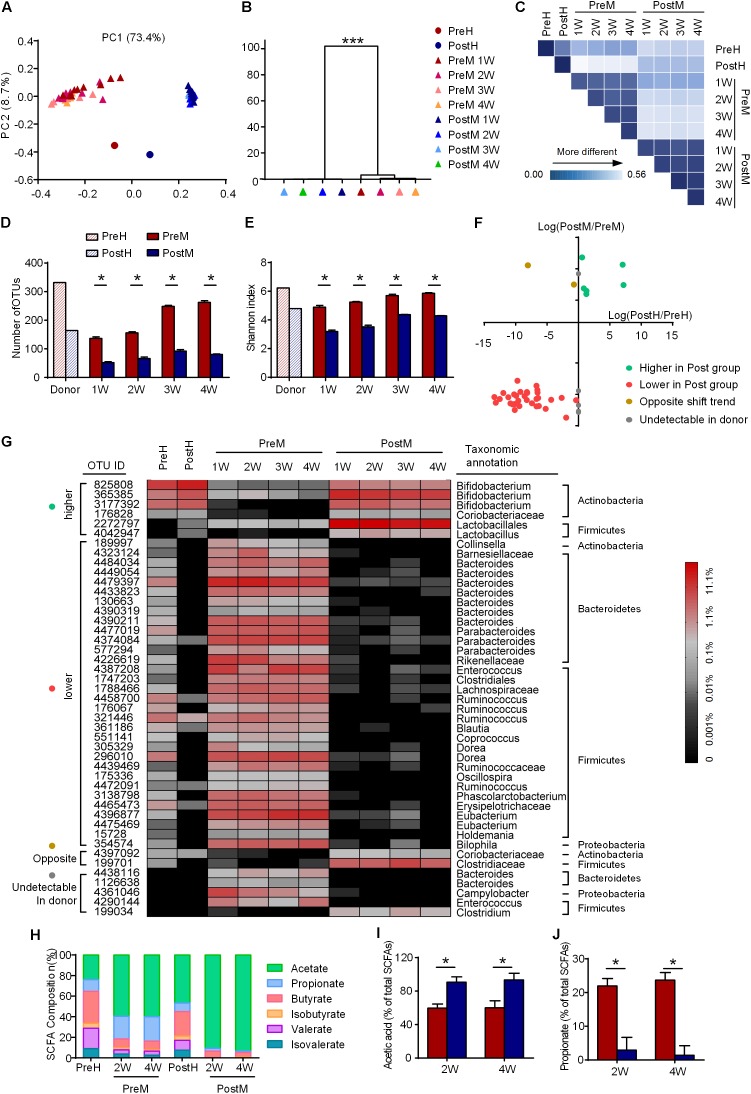
FIGURE 2.
The features of gut microbiota are transferrable from the human donor to the GF mice. (A) Weighted UniFrac PCoA plot and (B) multivariate analysis of variance analysis of gut microbiota based on OTUs, ∗∗∗P < 0.001; (C) weighted UniFrac distances of gut microbiota between the donor and recipients; (D) OTU richness; (E) Shannon index; (F) abundance variation of 45 discriminatory OTUs in the donor and recipients; (G) heat map of 45 discriminatory OTUs, with the color of the spot corresponding to the normalized and log-transformed relative abundance; (H) the composition of SCFA in feces of donor and the cecum of the recipients; (I) relative concentrations of acetate; and (J) relative concentrations of propionate. For the recipient groups, n = 9 on the 1st and 2nd week; n = 4 or 5 on the 3rd and 4th week. In D,E,I, and J, data are shown as the mean ± SEM and were compared between groups using the Mann–Whitney U test. ∗P < 0.05. PC, principal coordinate; OTU, operational taxonomic unit; SCFA, short chain fatty acid.

