FIGURE 2.

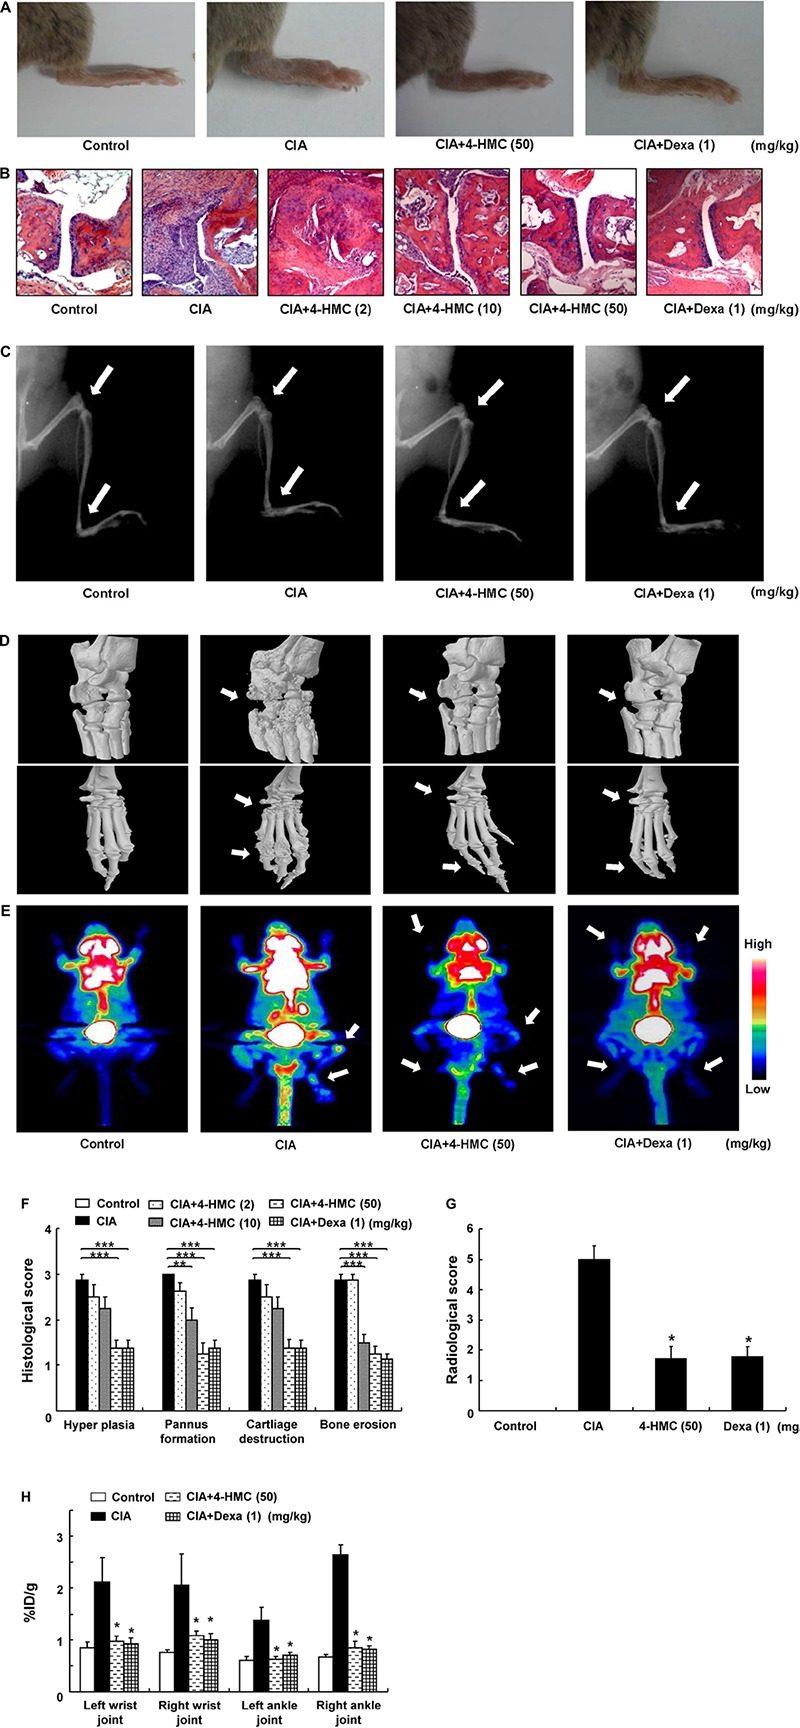
Histologic, radiologic, micro-computed tomography (CT), and [18F] FDG micro-positron emission tomography (PET) changes in collagen-induced arthritis (CIA) mice. (A) Representative clinical images of the hind paws. (B) Representative photomicrographs of paw sections stained with H&E (original magnification × 100). (C) Representative radiographic images of the hind paws. (D) Representative micro-CT images of the ankle joints. (E) Representative maximum intensity projection PET images; [18F] FDG accumulation at the site of inflammation was observed by glucose metabolism. (F) Histological scores were determined after observation of the H&E sections. (G) Radiological scores were determined as described in the section “Materials and Methods.” (H) Estimation of rheumatoid arthritis severity based on micro-PET imaging. The data are presented as the mean ± SD of five determinations. ∗∗∗p < 0.001; ∗∗p < 0.01; ∗p < 0.05, significantly different from untreated CIA mice. 4-HMC, 4-(hydroxymethyl)catechol; Dexa, dexamethasone.
