Figure 2.

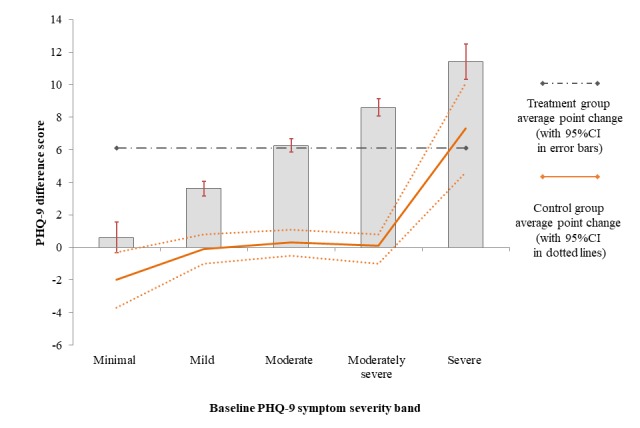
Measurement of mean treatment-related PHQ-9 symptom change per initial pretreatment symptom severity band; whiskers represent 95% CI s. Symptom change observed under control conditions indicated by a solid trend line.

Measurement of mean treatment-related PHQ-9 symptom change per initial pretreatment symptom severity band; whiskers represent 95% CI s. Symptom change observed under control conditions indicated by a solid trend line.